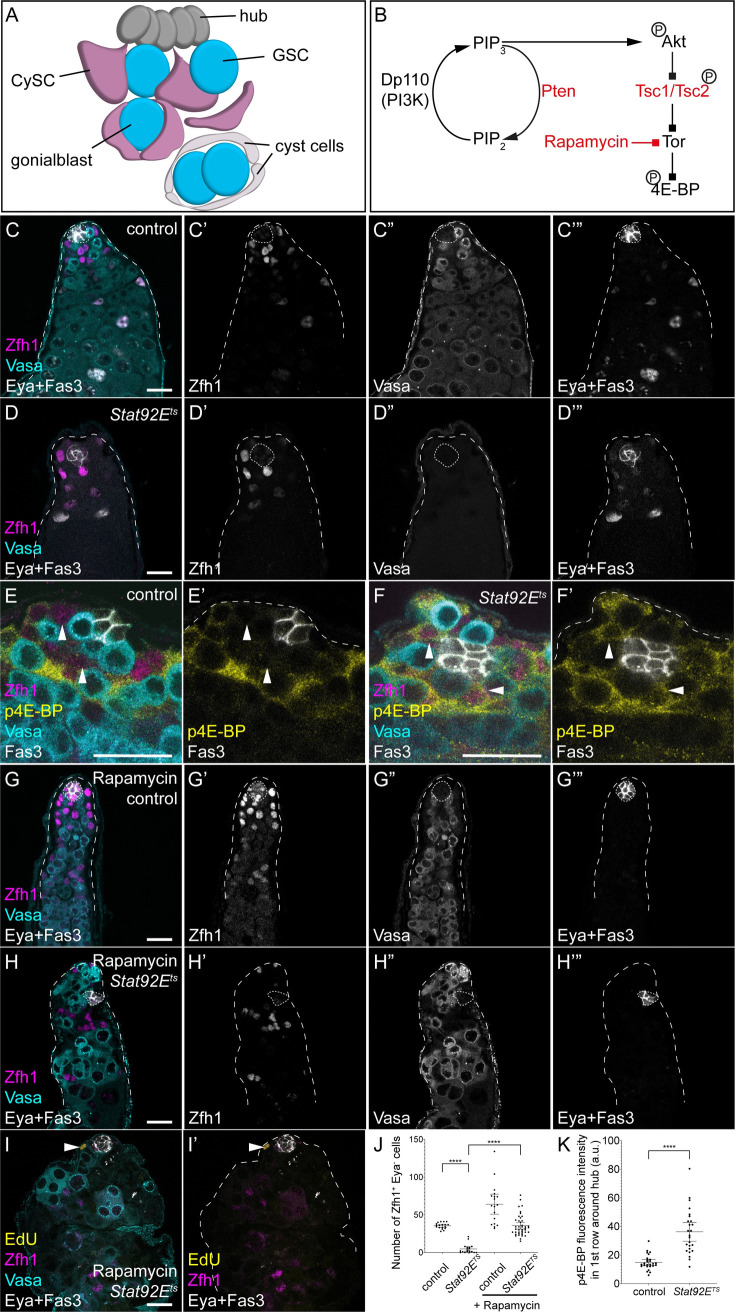
Fig 1. Tor is required for cyst cell differentiation in the absence of the self-renewal signal JAK/STAT.
A. Diagram representing the apical tip of the Drosophila testis. Hub cells (dark grey) support two stem cell populations: GSCs (blue) and CySCs (magenta). GSCs divide to give rise to gonialblasts that are wrapped by two CySC daughters. These differentiate into cyst cells (white) and support the encysted germline. B. Simplified schematic of the PI3K/Tor pathway. Activated PI3K phosphorylates Phosphatidylinositol 4,5-bisphosphate (PIP2) into Phosphatidylinositol (3,4,5)-trisphosphate (PIP3), which results in the phosphorylation and activation of Akt. In turn, Akt phosphorylates Tsc2 to lead to Tor activation. Active Tor phosphorylates 4E-BP, which is a readout for pathway activity. Pten, Tsc1 and Tsc2 in red are negative regulators of the pathway, while the drug rapamycin inhibits Tor activity. C,D. Control and Stat92Ets animals shifted to 29°C for 7 days showing loss of both CySCs and GSCs in the Stat92Ets mutant. Zfh1 (magenta, single channel C’,D’) labels CySCs and early daughters, Vasa (cyan, single channel C”,D”) labels the germline, and Eya and Fas3 (white, single channel C”’,D”’) label differentiated cyst cells and the hub, respectively. E,F. p4E-BP is upregulated early in CySCs upon loss of JAK/STAT signalling. In controls (E), high levels of p4E-BP (yellow) are detected in Zfh1-positive (magenta) cells two rows away from the hub (Fas3-positive, white). In Stat92Ets mutants shifted for 6 h, high p4E-BP is visible in CySCs contacting the hub (arrowheads). Vasa labels the germline in cyan and shows GSCs contacting the hub in both conditions. G-I. Rapamycin feeding inhibits CySC differentiation even in Stat92E mutants. In controls (G), rapamycin feeding results in Zfh1-expressing cells (magenta, G’) being found throughout the testis, and no Eya-positive cells (white, G”‘, compare to C”‘). Rapamycin prevents the loss of Zfh1-expressing CySCs in Stat92Ets mutants after 7 days at 29°C (H), and no Eya-expressing cells are visible. I. EdU incorporation (yellow) is detected in a Zfh1-expressing cell (arrowhead). Vasa (cyan) labels the germline. J. Quantification of the number of Zfh1-positive, Eya-negative CySCs in control and Stat92Ets mutants, raised on control food or with rapamycin. **** denotes P<0.0001, as determined by Kruskal-Wallis and Dunn’s multiple comparisons test. K. Quantification of p4E-BP fluorescence intensity in CySCs, identified as Zfh1-positive cells one cell diameter from the hub. Fluorescence in CySCs significantly increased in Stat92Ets testes shifted to the restrictive temperature for 6 h. **** denotes P<0.0001 as determined by Student’s t-test. Lines in J and K indicate mean and 95% confidence interval. The hub is indicated with Fas3 expression or a dotted line. Scale bar in all panels represents 20 μm.

