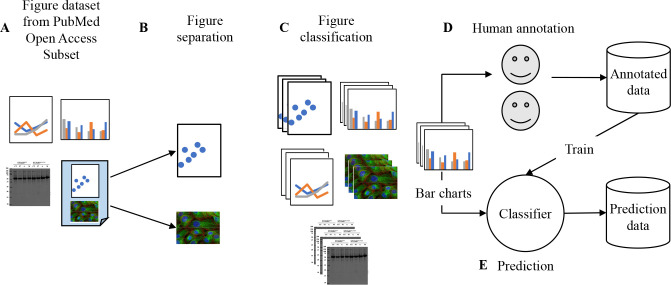
Fig 1. Process for labeling and predicting violations of the proportional ink principle in bar charts.
A. Figures from the PubMed Open Access Subset (PMOAS) dataset are the source data. See Materials and Methods for details to (B) separate figures if they are compounded and (C) classify them into different kinds of charts. D. A large sample of bar charts are annotated by humans. E. These annotations are used to train a classifier and predict a large number of bar charts.

