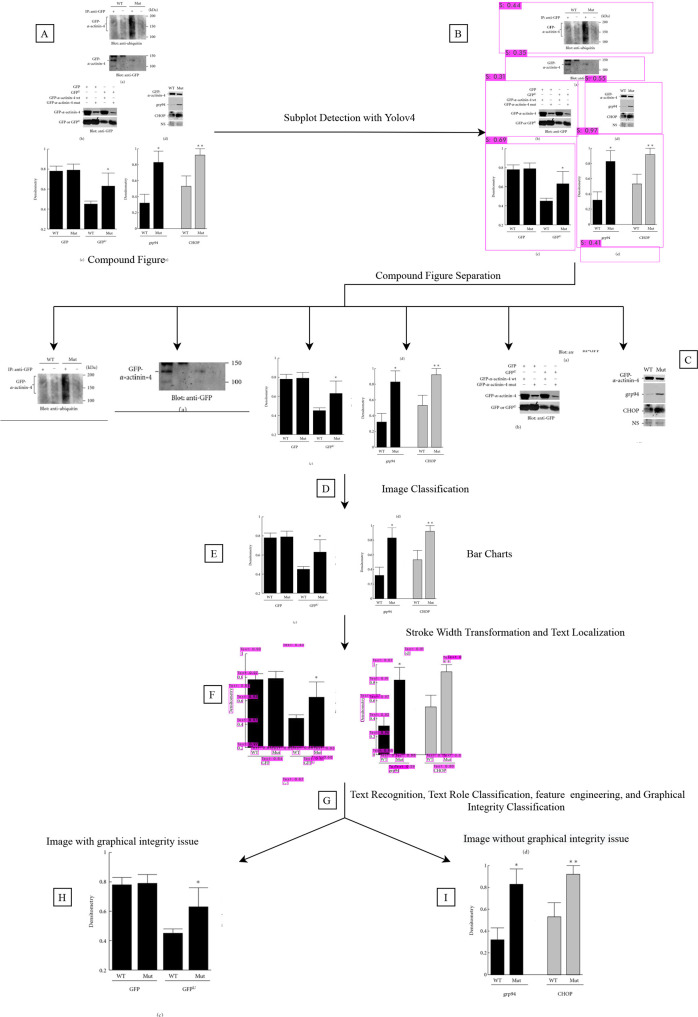
Fig 9. An example process for predicting violations of the proportional ink principle (see Materials and Methods for details, and our code is in https://github.com/sciosci/graph_check).
A. Input image representing a scientific figure. PubMed Open Access subset provides figures already extracted from the publications. B. Subplot extraction using the YOLO deep learning architecture [51] trained on the hand-annotated dataset (see Materials and Methods). C. Each subplot is extracted from the input image. D. Subfigure plot classification where only bar charts are extracted (E). For each bar chart, we detect a set of low-level features (F), which are later used for predicting whether a bar chart is violating the proportional ink principle (H, yes) or not (I, not).

