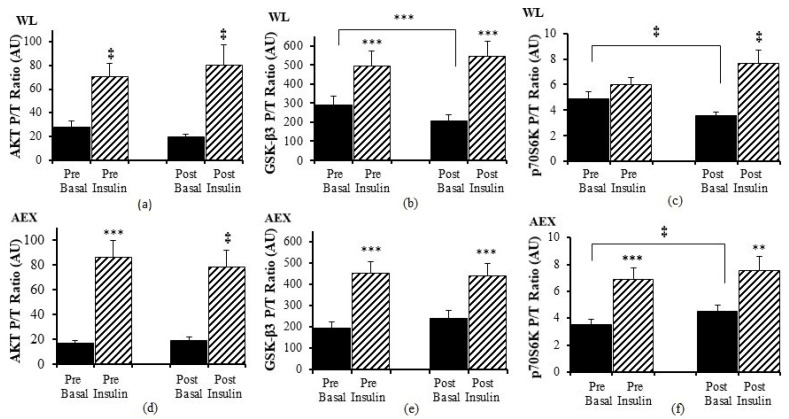
Figure 1.
Skeletal muscle Akt, GSK-3β and p70S6K phosphorylation, and total protein expression ratio during basal (solid) and insulin-stimulated (striped) pre and post WL (a–c) and AEX (d–f). Paired t-tests between pre basal vs. pre insulin, post basal vs. post insulin, and pre vs. post basal analyses within WL and within AEX were performed using the SPSS software version 27 (SPSS Inc., Chicago, IL, USA). ** p ≤ 0.01; *** p ≤ 0.001, ‡ p ≤ 0.005.

