Figure 3.
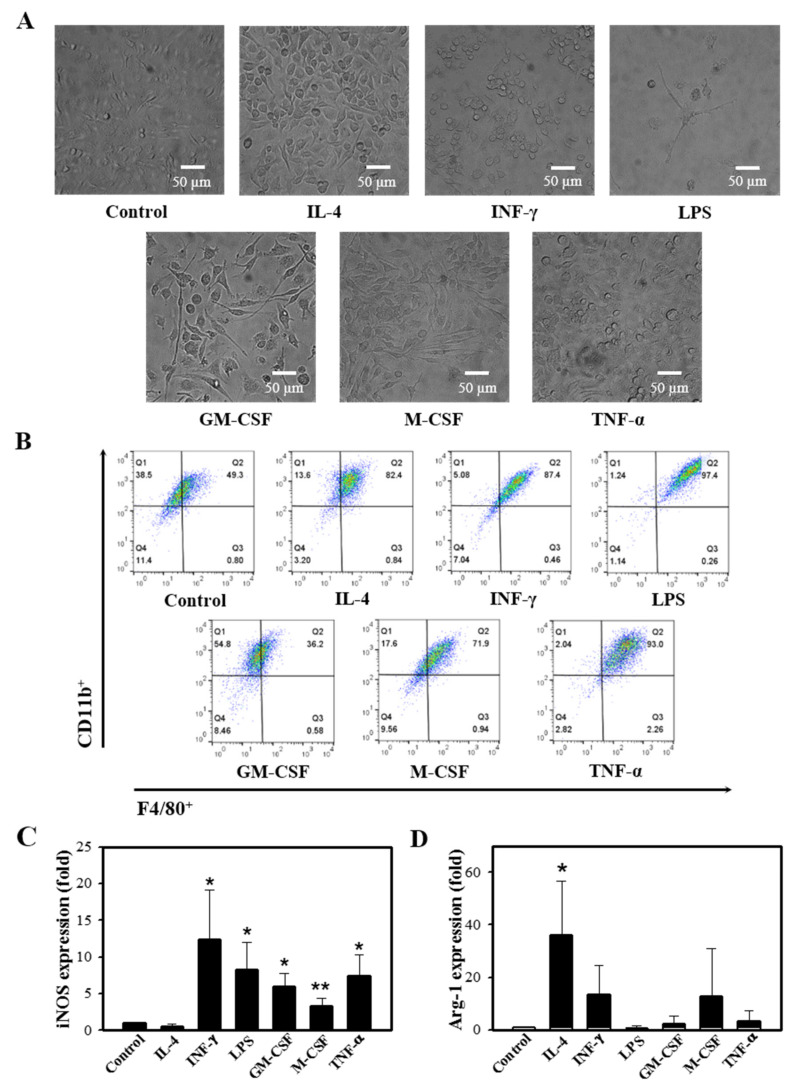
Different ligands induce M1/M2 polarization. Murine BMCs were treated with a variety of stimuli, such as 10 ng/mL IL-4, 50 ng/mL IFN-γ, 10 µg/mL LPS, 10 ng/mL GM-CSF, 30 ng/mL M-CSF, and 10 ng/mL TNF-α in the presence of 30 ng/mL M-CSF on day 5, followed by 5 days of incubation. (A) Cell images after 10 days of differentiation were acquired (n = 4). (B) Representative flow cytometry of cells in response to stimuli, X axis: F4/80+, Y axis: CD11b+ (n = 3). (C,D) Relative gene expressions of iNOS and Arg-1 by the M1/M2 modulating stimuli were determined by qRT-PCR (n = 3). Results are presented as mean ± SD; * p < 0.05 and ** p < 0.01 compared to control (Student’s t-test).

