Figure 6.
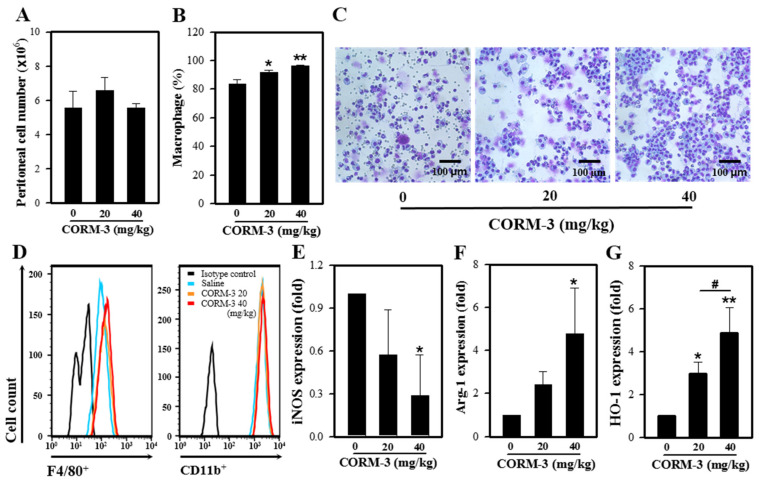
CO enhances M2 polarization in vivo. Mice were injected with 3% thioglycollate followed by CORM-3, and peritoneal exudate cells were collected. (A) The number of total peritoneal exudate cells was counted. (B) The proportion of macrophages in peritoneal exudates was determined after Diff-Quik staining, and (C) the representative images of peritoneal exudate cells. (D) Peritoneal exudate cells were stained with antibodies F4/80-FITC and CD11b-PE and analyzed using FACSCalibur. (E–G) The mRNA expressions of iNOS, Arg-1, and HO-1 were determined by qRT-PCR. Results are presented as mean ± SD (n = 3); * p < 0.05 and ** p < 0.01 compared to control and # p < 0.05 between groups compared (one-way ANOVA).

