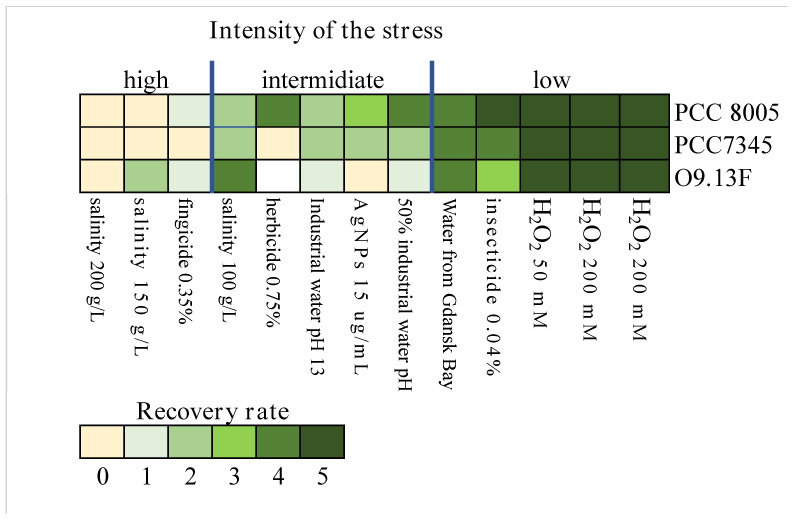
Figure 5.
The heatmap presents the recovery rates of eight tested Arthrospira strains, O9.13F, PCC 7345 and PCC 8005 cultivated in stress conditions. Above the heatmap, three levels of the stress severity (low, intermediate, high) are grouped according to the overall similarity of the different strains’ responses. The colour scale given in the heatmap key corresponds to the recovery rate. The survivability of the biomass was assessed based on the condition, duration of the lag phase and visible increase in the number of viable filaments and recorded by the following system: 0—degradation of the filaments, 1—whole, nonfragmented filaments present, no growth observed, 2—growth observed after two weeks of a lag phase, 3—very weak growth recorded after one week of a lag phase, 4—stable growth after a short lag phase, 5—very abundant growth without a lag phase.

