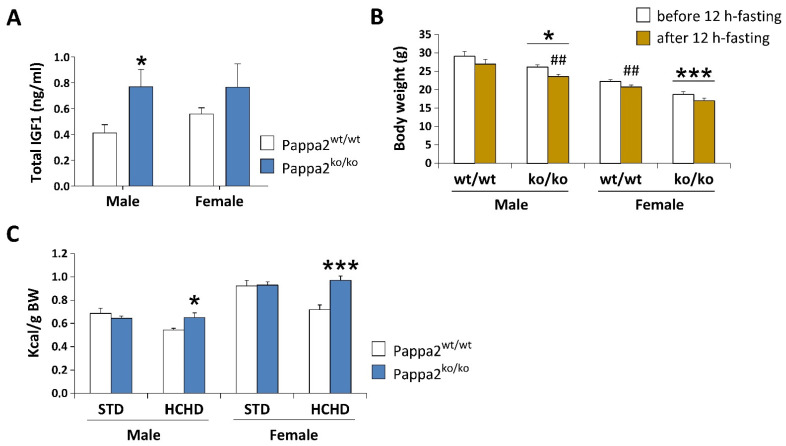
Figure 5.
Analysis of plasma concentrations of total IGF1 (A), body weight (BW) before and after 12 h-fasting (B), and caloric intake relative to BW after 3 week-feeding of a standard (STD: 2.9 kcal/g) or a high carbohydrate (HCHD: 3.85 kcal/g) diet (C) in constitutive Pappa2 KO mice of both sexes at 8 months old. Data are represented as mean ± S.E.M. (n = 7–8/group). Tukey-corrected tests: */*** p < 0.05/0.001 versus respective Pappa2wt/wt mice; ## p < 0.01 versus mice before 12 h-fasting.

