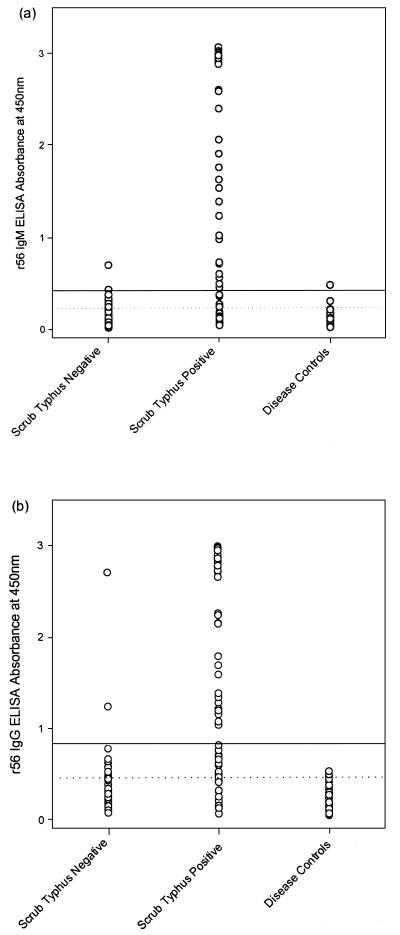
FIG. 3.
Individual assay values for the r56 IgM ELISA (a) and the r56 IgG ELISA (b). The cutoff values determined by TG-ROC analysis are shown by a broken line, while the cutoff selected to maximize diagnostic performance when the IgM and IgG ELISAs were used in combination is shown by an unbroken line. Scrub typhus-positive cases were classified by either elevation of IIP, positive IFA, or the presence of an eschar, while scrub typhus-negative cases were IIP and IFA negative, and no eschar was present. Disease controls were cases of SF or MT.

