Figure 3.
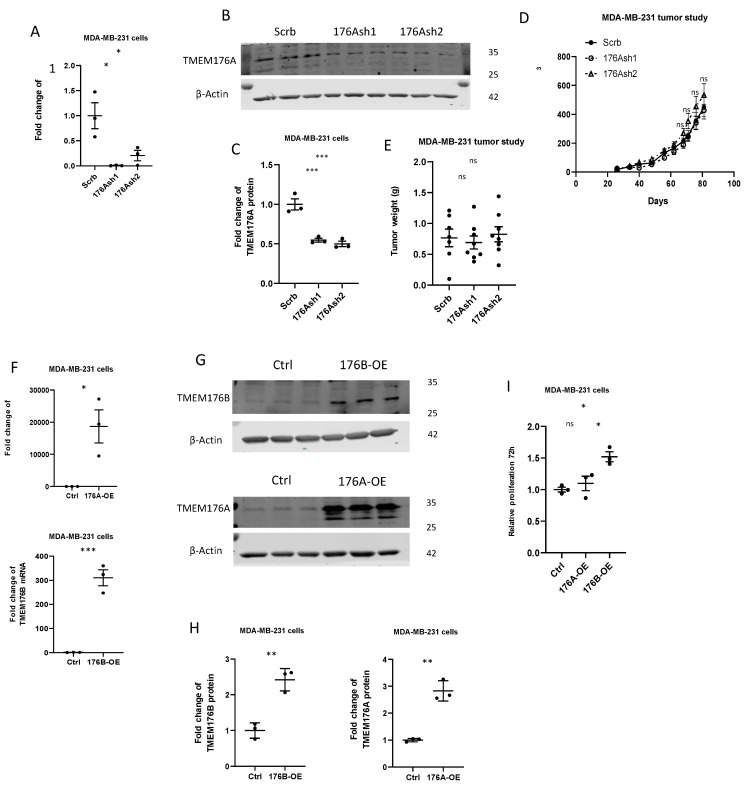
TMEM176B but not TMEM176A affected cell proliferation and tumor growth. (A) TMEM176A mRNA expression was evaluated by qRT-PCR in control (Scrb) and TMEM176A-silenced (176Ash1, 176Ash2) MDA-MB-231 cells (n = 3 per group, with two independent experiments). (B,C) Representative Western blot image and quantification of TMEM176A protein expression (n = 3 per group, with three independent experiments). (D) Growth charts of MDA-MB-231 control (Scrb), and TMEM176A-silenced (176Ash1 and 176Ash2) tumor xenografts in the Rag1−/− female mice (n = 6–8 mice per group). (E) Tumor weight at the end of the study. (F) TMEM176A and TMEM176B mRNA expression was evaluated by qRT-PCR in control (Ctrl) and TMEM176A-overexpressing (176A-OE) or TMEM176B-overexpressing (176B-OE) (n = 3 per group, with two independent experiments). (G,H) Representative Western blot image and quantification of TMEM176A and TMEM176B protein expression (n = 3 per group, with three independent experiments). (I) Proliferation assay of control (Ctrl) and TMEM176A- and TMEM176B-overexpressing MDA-MB-231 cells after 96 h (n = 3 per group in one independent experiment). Data are presented as means ± SEM. Differences between groups were evaluated by Student’s t-test (F,H) and the one-way (A,C,E,D,I) ANOVA test with the Bonferroni post hoc test. * p < 0.05. ** p < 0.01. *** p < 0.001. ns: not significant.

