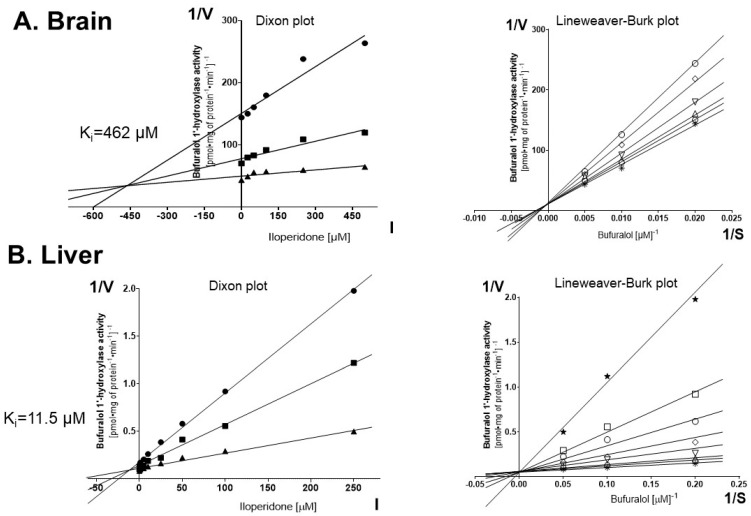
Figure 1.
The effects of iloperidone added in vitro to pooled brain or liver microsomes (n = 10) on the activity of CYP2D determined as the rate of bufuralol 1′-hydroxylation. Each point shows the mean value of two independent analyses. (A) Brain. Kinetic parameters: Km = 492.1 μM, Vmax = 0.076 pmol∙mg protein−1∙min−1, Ki = 462 µM. Dixon plot: bufuralol concentrations of 50 µM (●), 100 µM (■) and 200 µM (▲). Lineweaver-Burk plot: control—no asenapine (✱); the asenapine concentrations of 25 µM (⎔), 50 µM (△), 100 µM (▽), 250 µM (◊) and 500 µM (○). (B) Liver. Kinetic parameters: Km = 8.26 μM, Vmax = 15.45 pmol∙mg protein−1∙min−1, Ki = 11.5 µM. Dixon plot: bufuralol concentrations of 5 µM (●), 10 µM (■) and 20 µM (▲). Lineweaver–Burk plot: control—no asenapine (✱); the asenapine concentrations of 1 µM (⎔), 5 µM (△), 10 µM (▽), 25 µM (◊), 50 µM (○), 100 µM (◻) and 250 µM (★). V, velocity of the reaction; I, the inhibitor (iloperidone) concentration; S, the substrate (bufuralol) concentration.

