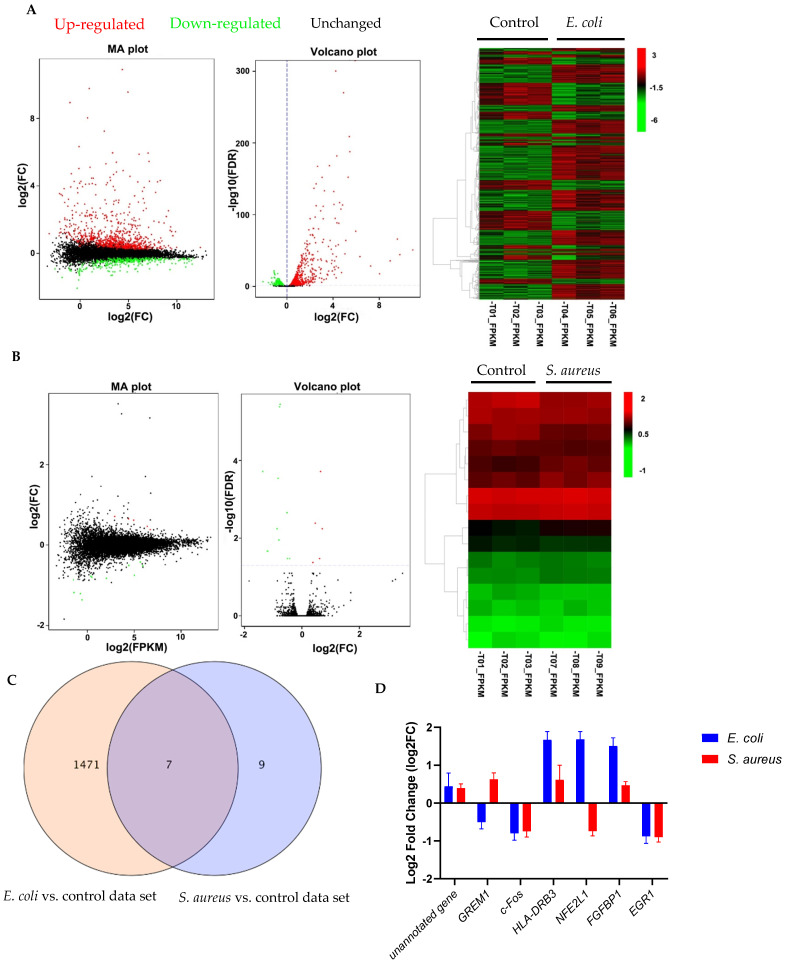
Figure 1.
Gene expression profiling analysis of differential expression genes. (A,B) MA plots, volcano plots and hierarchical clustering showing differential expression profiles in primary cultures of bovine mammary epithelial cells (pbMECs) stimulated with heated-killed E. coli (A) or S. aureus (B) compared to unstimulated cells. Differentially expressed genes are established at log2(FC) > 0.1 and false discovery rate (FDR) < 0.05. FC, fold change; FPKM: Fragments Per Kilobase Million. (C) Venn diagram comparing the gene expression changes induced by heated-killed E. coli or S. aureus. (D) Expression patterns of the overlapping differentially expressed transcripts between E. coli- and S. aureus-stimulated cells compared with control showing in (C). Results are expressed as log2FC over unstimulated control cells. Data are mean ± s.d. of triplicates.

