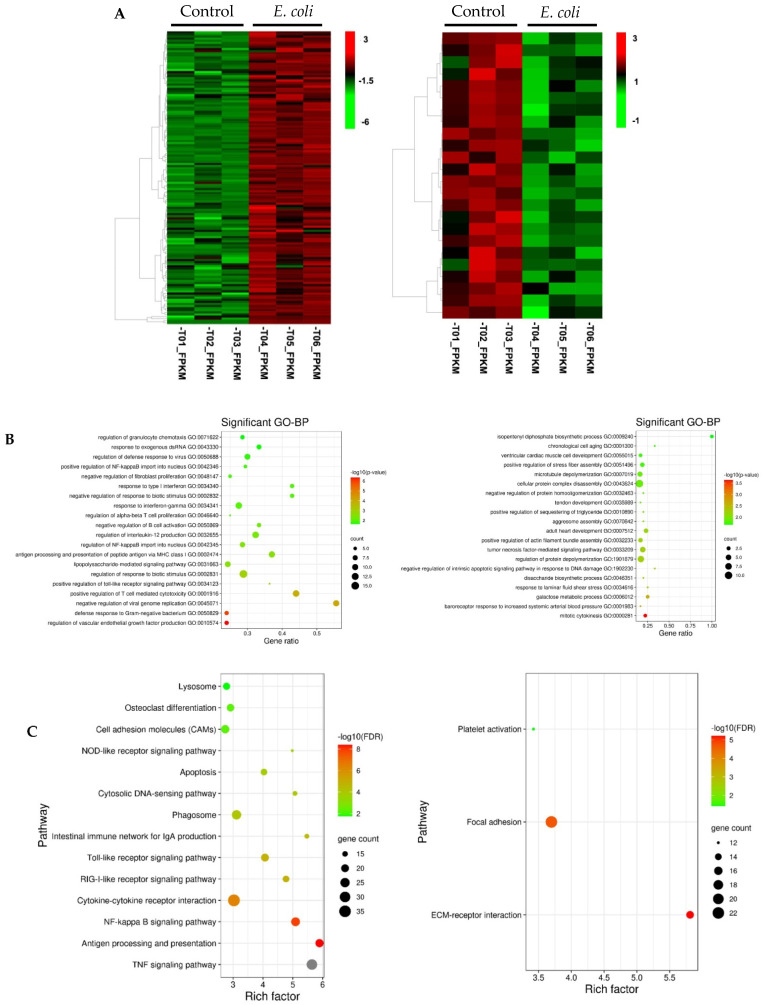
Figure 2.
Function annotation and pathway analysis for the up- and downregulated genes between normal vs. E. coli samples. (A) Hierarchical clustering of gene expression for the up- (left panel) and downregulated (right panel) genes. Row represent individual genes and columns represent the expression changes of replicate for each investigated group. Red color indicates relative over-expression, while green color indicates relative under-expression. (B) Bubbleplot for GO enrichment of the upregulated (left panel) the downregulated genes (right panel) with statistically significant biological processes (FDR < 0.05). The top 20 GO enrichment terms are presented. y-axis: ontological terms; x-axis, the gene ratio of enriched among the background genes in each ontological term. (C) Bubbleplot for KEGG pathway enrichment of the up- (left panel) and downregulated (right panel). Significant enrichment of a pathway was defined as FDR < 0.05. y-axis, functional pathways; x-axis, rich factor. The size of the bubble is proportional to the number of genes assigned to the GO/KEGG entry and the color corresponds to the adjusted p value. A high FDR is represented by red, and a low value is represented by green. GO, Gene Ontology; KEGG, Kyoto Encyclopedia of Genes and Genomes.

