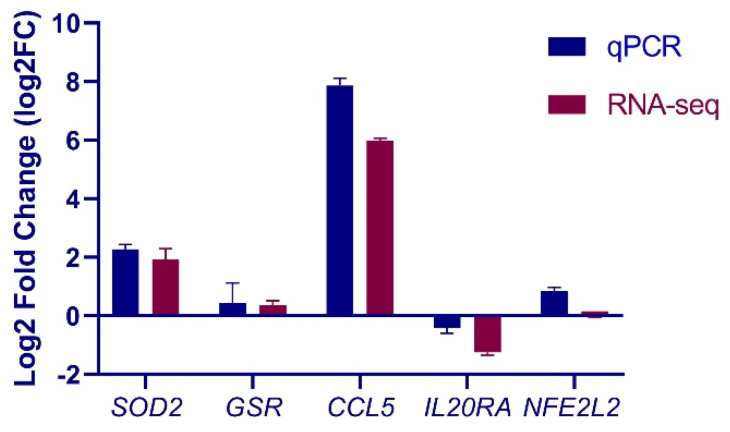
Figure 4.
Real-time quantitative PCR (qPCR) validation of RNA sequencing (RNA-Seq) data. Relative mRNA abundance of Nrf2, Chemokine (C–C motif) ligand 5 (CCL5), glutathione reductase (GSR1), superoxide dismutase 2 (SOD2) and interleukin 20 receptor alpha (IL20RA) in E. coli-stimulated cells determined by RNA-seq and qPCR measurements. Results are expressed as log2FC over unstimulated control cells. Data are mean ± s.d. of triplicates.

