Figure 5.
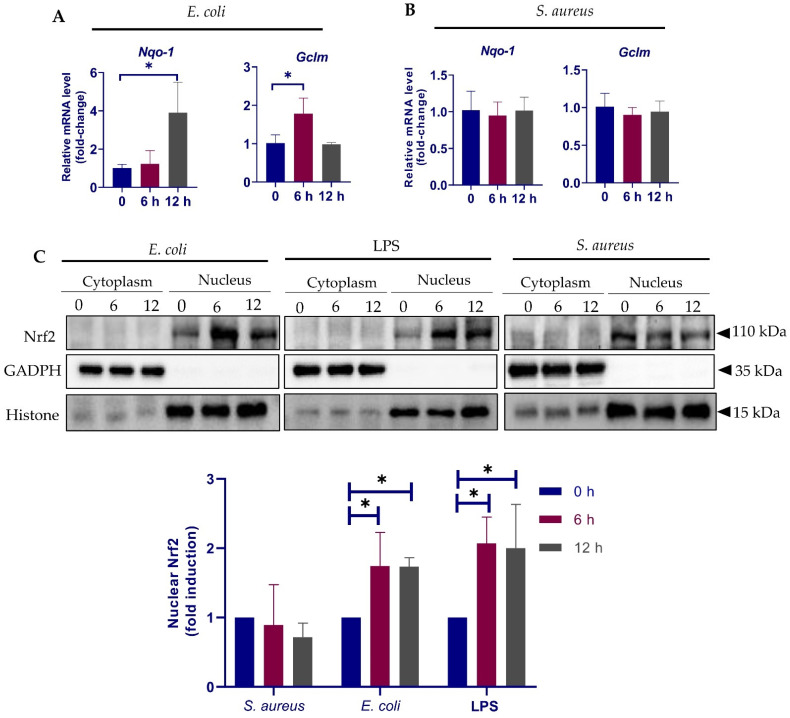
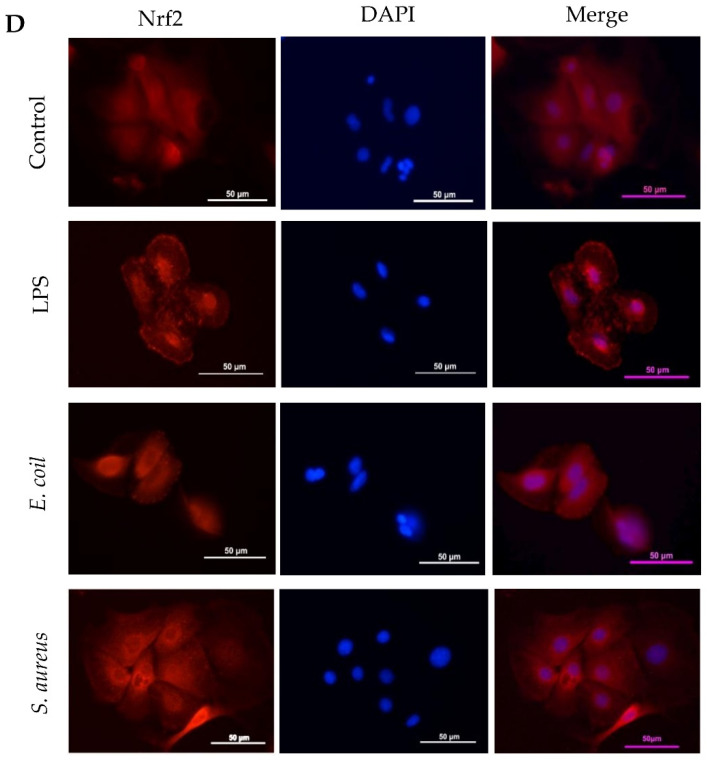
Response of Nrf2 pathway to E. coli and S. aureus. (A,B) pbMECs were treated with heat-killed E. coli (1 × 10⁷ particles/mL) (A) and S. aureus (1 × 10⁷ particles/mL) (B), respectively, for the indicated time. Nqo-1 and Gclm mRNA expression was quantified by qPCR. Fold change is relative to control cells. Data are means ± s.d. of three triplicates and are representative of 3 separate experiments. (C) Cytoplasmic and nuclear proteins extracted from cells treated with E. coli (1 × 10⁷ particles/mL), S. aureus (1 × 10⁷ particles/mL) and lipopolysaccharides (LPS) (10 μg/mL) were analyzed by immunoblotting with anti-Nrf2. GADPH and Histone are shown as loading controls, respectively. Nuclear Nrf2 protein levels were determined with densitometry analyses after normalization to Histone. Bars are means ± s.d. of three triplicates and are representative of 3 separate experiments. * p < 0.05. (D) After treatment with E. coli, LPS or S. aureus for 12 h as described above, cells were subjected to immunofluorescent staining. Nrf2 was stained with an Alexa Fluor 594-conjugated secondary antibody. Cell nuclei were visualized by 4′,6-Diamidino-2-phenylindole dihydrochloride (DAPI). The images were obtained using inverted fluorescence microscopy.


