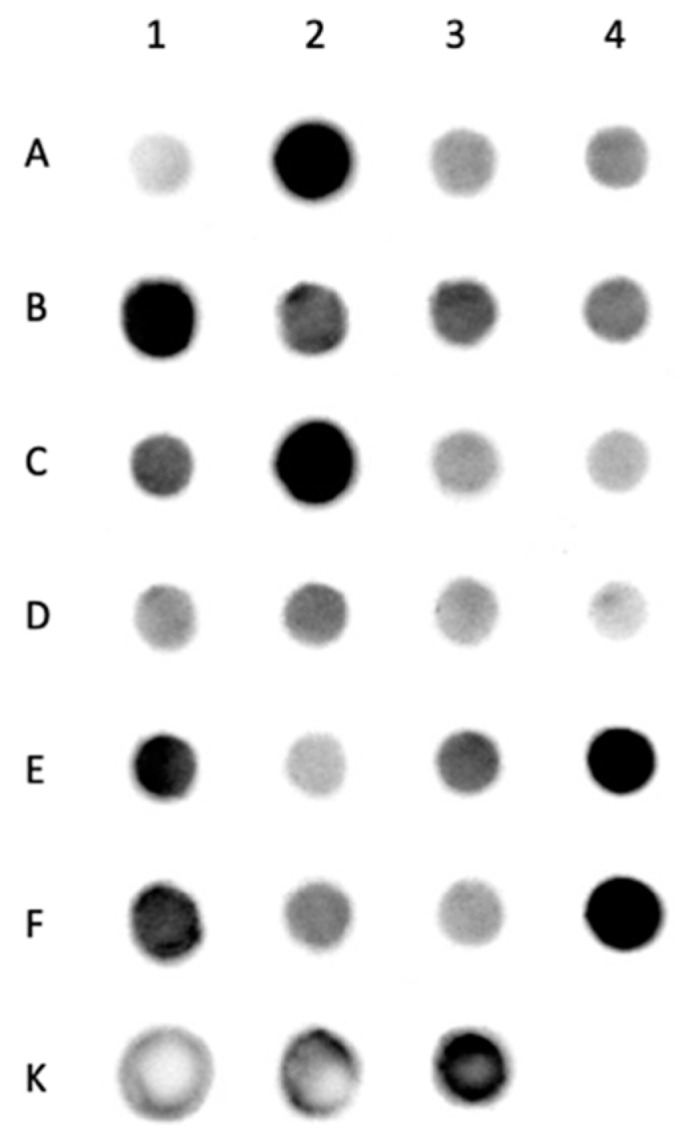
Figure 3.

Dot blot analysis of MUC8 in salivary stones from the excretory ducts of the submandibular glands. Each dot shows the positive detection of MUC8 in a salivary stone. The darker the dot, the higher the MUC8 concentration. Next to it in tabular form the sample designations, 1–24 denote the protein samples of the salivary stones, K1–K3 describe the saliva samples as positive controls. The intensity of the black staining indicates the different amounts of MUC8 contained. Individual samples (2, 5, 10, 20, 24) show a strong signal, whereas others react only very weakly (e.g., 1, 16). The positive controls are also stained black with varying intensity.
