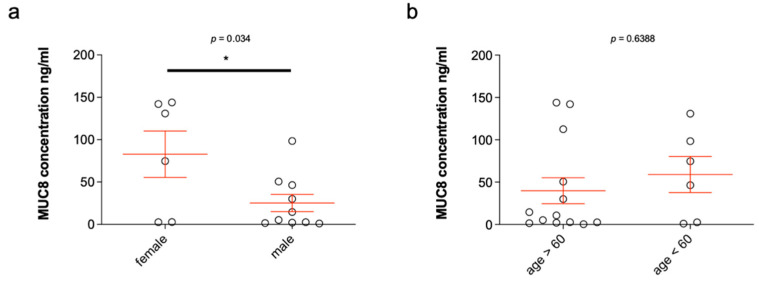
Figure 5.
MUC8 concentrations in 20 saliva samples from the excretory ducts of the submandibular glands of 10 patients who had a salivary stone in the excretory duct system of the submandibular gland on one side (x) and not on the other (Table 2) and statistical analysis in relation to sex (a) and age (b). The concentrations of MUC8 are shown in ng/ml in each case. The MUC8 concentrations shown in the bar chart (Table 2) illustrate the large scatter of concentration values between the individual saliva samples. Statistical analysis of the determined MUC8 concentrations shows statistically significant values in the distribution by gender (a, p ≤ 0.034) and no significant values for distribution by age (b, Table 2) (* p ≤ 0.05).

