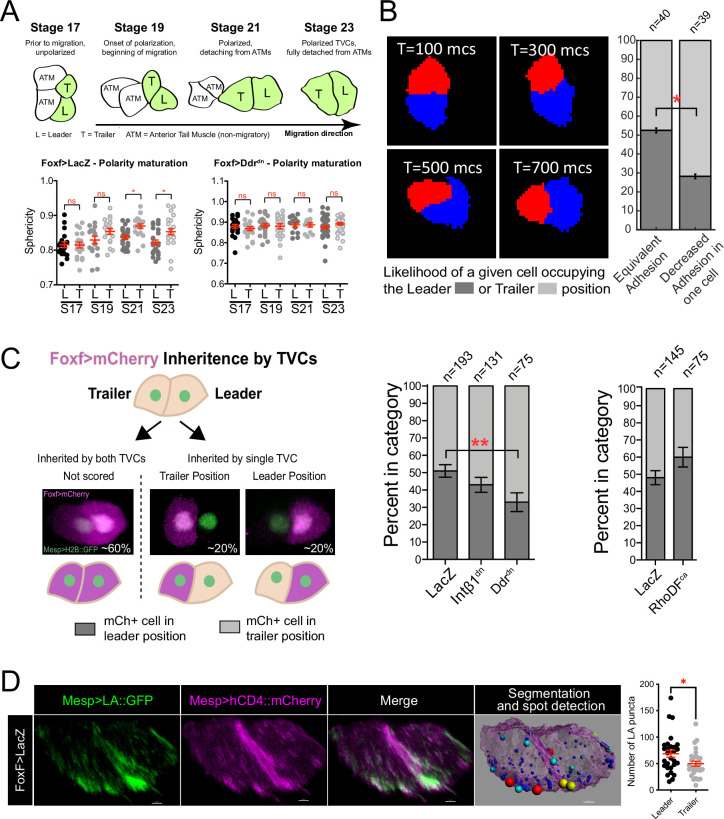
Figure 2. Polarized matrix adhesion promotes adoption of leader/trailer cell state.
(A) Establishment of leader/trailer polarity as measured by the asymmetry that develops between leader and trailer sphericity as cells polarize in the direction of migration. Diagram depicts dorsal view of cells at stages when sphericity was calculated. Migratory cells are highlighted in green. L, leader; T, trailer; ATM, anterior tail muscle. Scatter plots show mean with standard error. Data were pooled from three biological replicates. Statistical significance tested using ANOVA followed by Bonferroni test to compare means. *p<0.05 (B) Simulation of decreasing extracellular matrix (ECM) adhesion in one cell (red) of a migrating cell pair. Cells are migrating to the right starting in a parallel orientation as shown in T = 100 Monte Carlo steps (mcs). Bar graphs show likelihood of either cell assuming the leader or trailer position in either control conditions (50/50 likelihood) or when adhesion in red cell is decreased. Standard error of proportion is shown, and statistical analysis of the proportions is done using Fisher’s exact test. (C) In vivo modulation of ECM adhesion using mosaic inheritance of the Foxf>Intβ1dn, Foxf>Ddrdn, and Foxf>RhoDFca, marked by Foxf>mCherry. Diagram shows a schematic of mosaic inheritance of transgenes and resulting distribution of mCherry fluorescence. Bar graphs show likelihood of cell that inherits the transgenic constrict to be found in either leader or trailer position. Data were pooled from three biological replicates. Error bars are standard error of proportion. Statistical analysis was performed using Fisher’s exact test. (D) Micrographs show distribution of Mesp>Lifeact::GFP in leader and trailer cells. Image on the right shows a representative rendered cell pair surface with spot detection based on 10% highest GFP intensity. Spots are color-coded from smallest (blue) to largest (red). Scatter plot on the right shows number of GFP puncta per cell. Data were pooled from two biological replicates. Statistical analysis was performed using Student’s t-test. *p<0.05.


