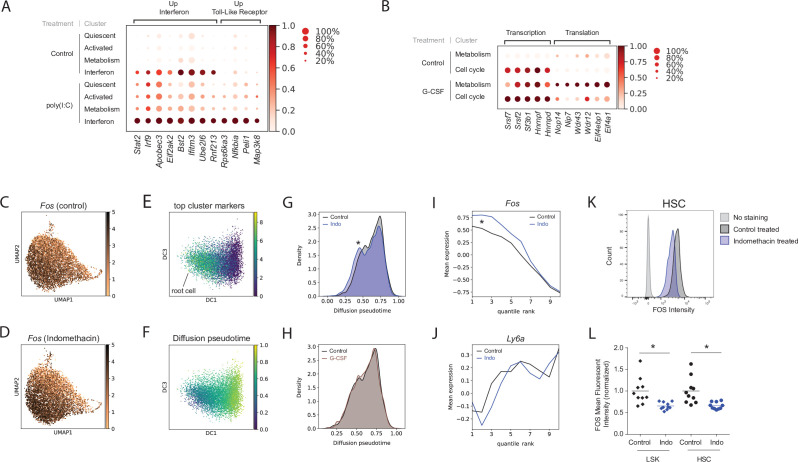
Figure 2. Poly(I:C), granulocyte colony-stimulating factor (G-CSF), and indomethacin induce cluster-specific transcriptional changes in hematopoietic stem cells (HSCs).
(A) Dot plot of representative genes from poly(I:C) treated and control HSC clusters (scaled expression across columns). (B) Dot plot of representative genes from the G-CSF-treated and control HSC clusters (scaled expression across columns). (C–J) Diffusion pseudotime analysis. Uniform manifold approximation and projection (UMAP) plot of Fos expression in control (C) and upon indomethacin (D) treatment, see also Figure 2—figure supplement 1A-B. Diffusion map embedding with combined expression of top ‘Activated’ genes to select root cell (E) and cells colored by pseudotime (F). Kernel density of pseudotime distribution comparing indomethacin and control (G, asterisk: p-value [Mann–Whitney U-test] = 5.8*10–12) and G-CSF and control (H). Average expression of Fos (I) and Ly6a (J) across cells ranked by pseudotime (cells split into 10 bins to decrease noise), change in transcript levels indicated by asterisk in I, see also Figure 2—figure supplement 1C-D. (K) Histogram of FOS levels via intracellular fluorescence-activated cell sorting (FACS) of HSCs, ‘no stain’ is FACS-negative control, ‘control’ is FOS in untreated mice. (L) Normalized mean fluorescent intensity (MFI) for FOS in control and indomethacin-treated HSCs (p-value = 6.2 * 10–3, Welch-corrected t-test, asterisk) and LSK cells (p-value = 6.6 * 10–3, Welch-corrected t-test, asterisk) across two independent biological replicate experiments, n(mice) = 20.


