. 2021 Dec 23;10:e66512. doi: 10.7554/eLife.66512

Figure 5. Heterogeneous distribution of interferon signaling response element (ISRE) and AP-1 motif in hematopoietic stem cells (HSCs) and Lin-, c-Kit+, Sca1+ (LSKs) and specific motif co-occurrences in HSCs.

(A) Schematic of downstream transcriptional signaling pathways for externalstimulants. (B–C) Uniform manifold approximation and projection (UMAP) plot of HSC (B) single-cell chromatin accessibility sequencing (scATAC-Seq) clusters (n = 730 cells) or LSK (C) scATAC-Seq clusters (n = 10,750 cells), see also Figure 5—figure supplement 1A-B. (D–E) Violin plots of transcription factor (TF) motif scores enriched in HSCs (D) and LSKs (E) with selected significant p-values (logistic regression) indicated by asterisks, see also Supplementary file 11 and Figure 5—figure supplement 1C-D.

Figure 5.

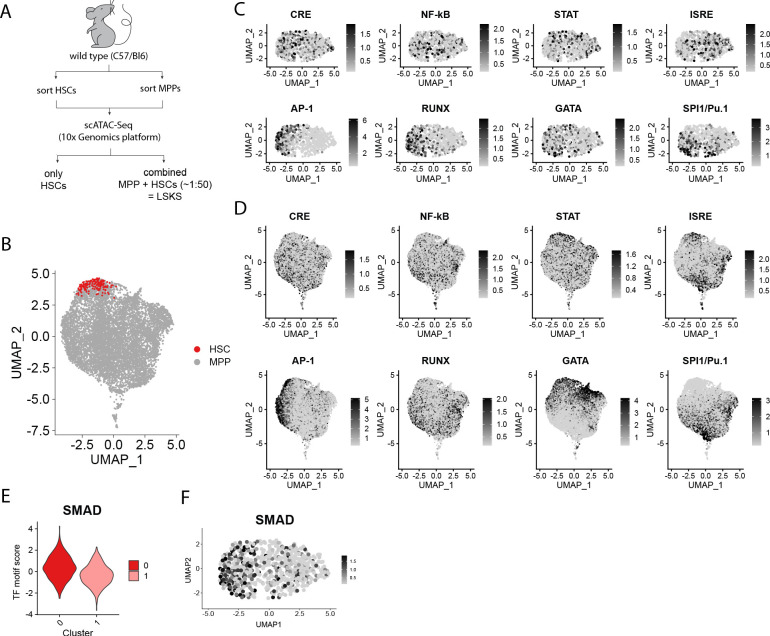
Figure 5—figure supplement 1. Uniform distribution of motif activity immediately downstream of external stimulants and differential enrichment for secondary signals in hematopoietic stem cells (HSCs) and Lin-, c-Kit+, Sca1+ (LSKs).

Figure 5—figure supplement 1.

(A) Schematic of fluorescence-activated cell sorting (FACS) and analysis of the single-cell chromatin accessibility sequencing (scATAC-Seq) experiment. (B) Uniform manifold approximation and projection (UMAP) plot of combined LSKs (n = 10,750 cells) colored by sorted HSCs or multipotent progenitors (MPPs). (C–D) UMAP plots of various transcription factor (TF) motif scores in HSCs (C) or LSKs (D). (E–F) Violin plot (E) and UMAP plot (F) of SMAD TF motif score in HSCs.