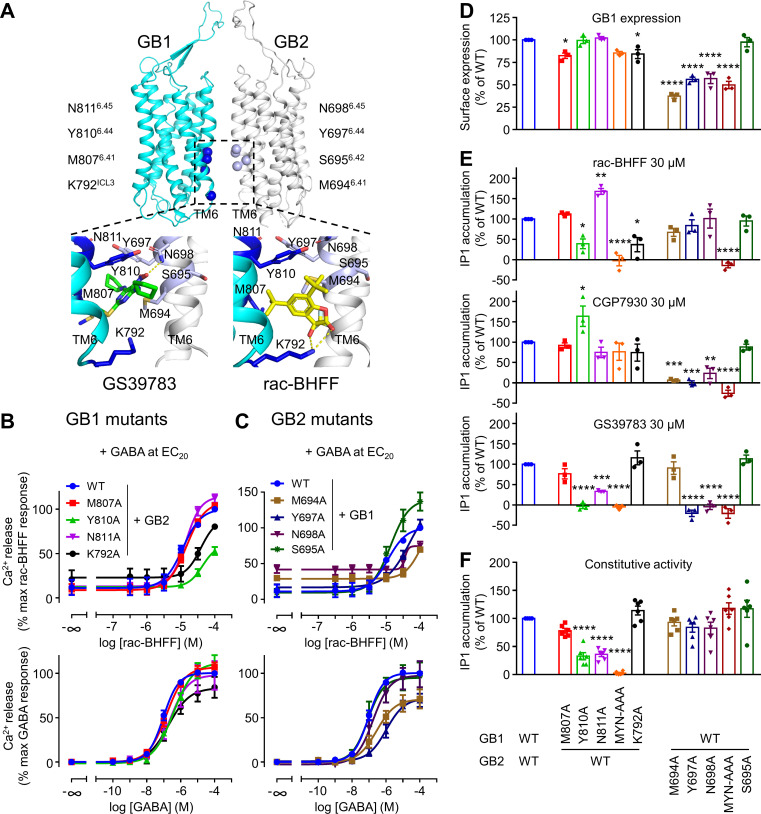
Figure 4. GB1 and GB2 TM6s interface is the binding site for the different positive allosteric modulators (PAMs).
(A) Structure of the GABAB receptor (PDB 6UO8) where the binding site of GS39783 (PDB 6UO8) and rac-BHFF (PDB 7C7Q) in the receptor is highlighted, and close-up view of the molecules bound (PAMs shown as sticks, and hydrogen bonds between PAMs and receptor are depicted as dashed yellow lines). The α-carbon of the main residues involving in the binding site for these PAMs is highlighted as a sphere in GB1 (blue) and GB2 (light blue). (B, C) Intracellular Ca2+ responses mediated by the indicated constructs upon stimulation with rac-BHFF in the presence of EC20 GABA, or GABA alone. Data are normalized by wild-type response of 100 μM rac-BHFF + EC20 GABA or 100 μM GABA, for rac-BHFF and GABA treatment, respectively, and shown as means ± SEM of 4–5 biologically independent experiments. (D) Quantification of cell surface-expressed GB1 in HEK293 cells transfected with the indicated HALO-tagged GB1 and SNAP-tagged GB2 constructs after labeling with HALO-Lumi4-Tb. Data are normalized by wild-type receptor and expressed as means ± SEM. (E, F) Inositol-phosphate-1 (IP1) production induced by the indicated PAMs (E) or basal IP1 accumulation (F) in intact HEK293 cells expressing the indicated subunit combinations. Data are normalized by wild-type response and shown as means ± SEM of 4–5 biologically independent experiments. Data are analyzed using one-way ANOVA test followed by a Dunnett’s multiple comparison test to determine significance (compared with the WT) with *p<0.05, **p<0.005, ***p<0.0005, ****p<0.0001.


