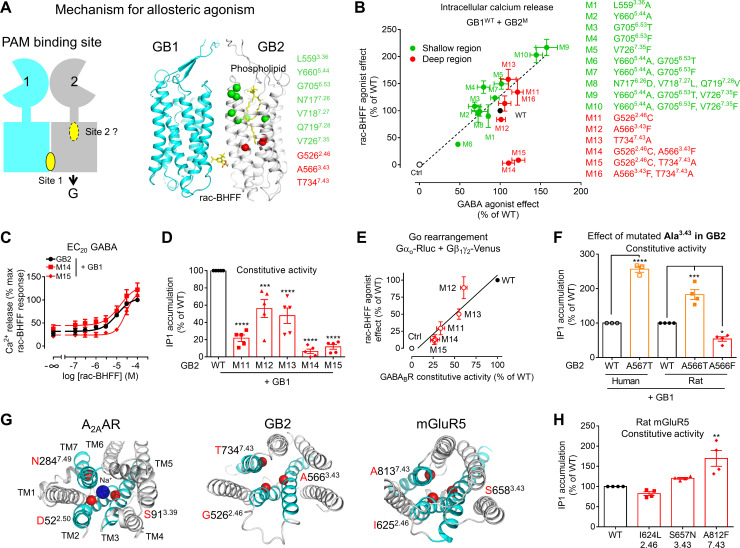
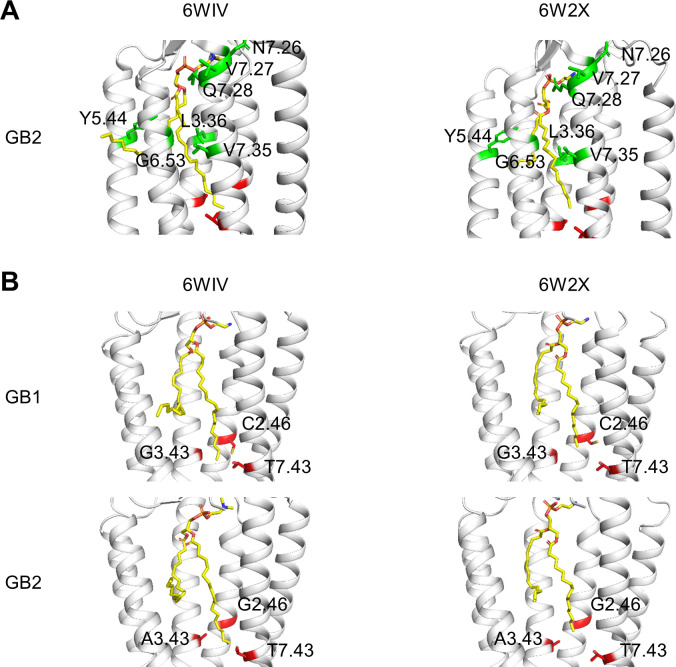
Figure 5. A deep region in GB2 transmembrane domain (TMD) is responsible for agonist activity of the positive allosteric modulator (PAM).
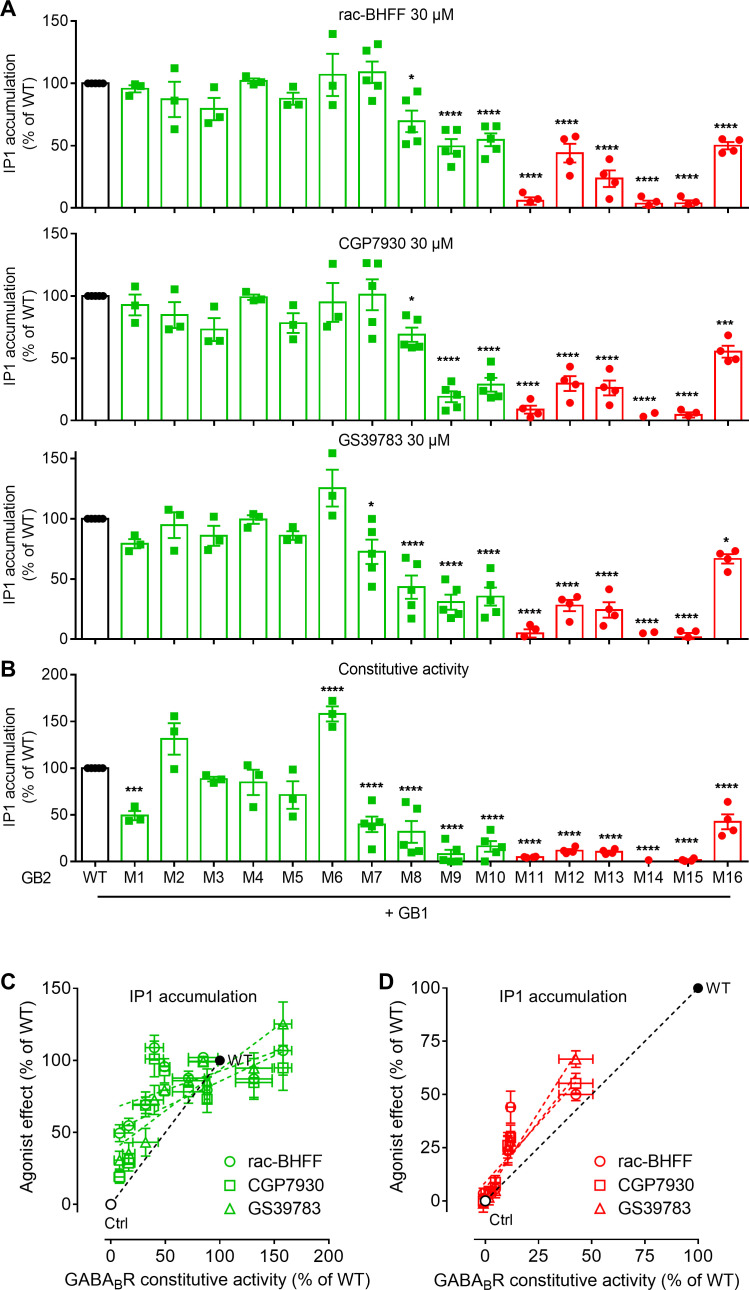
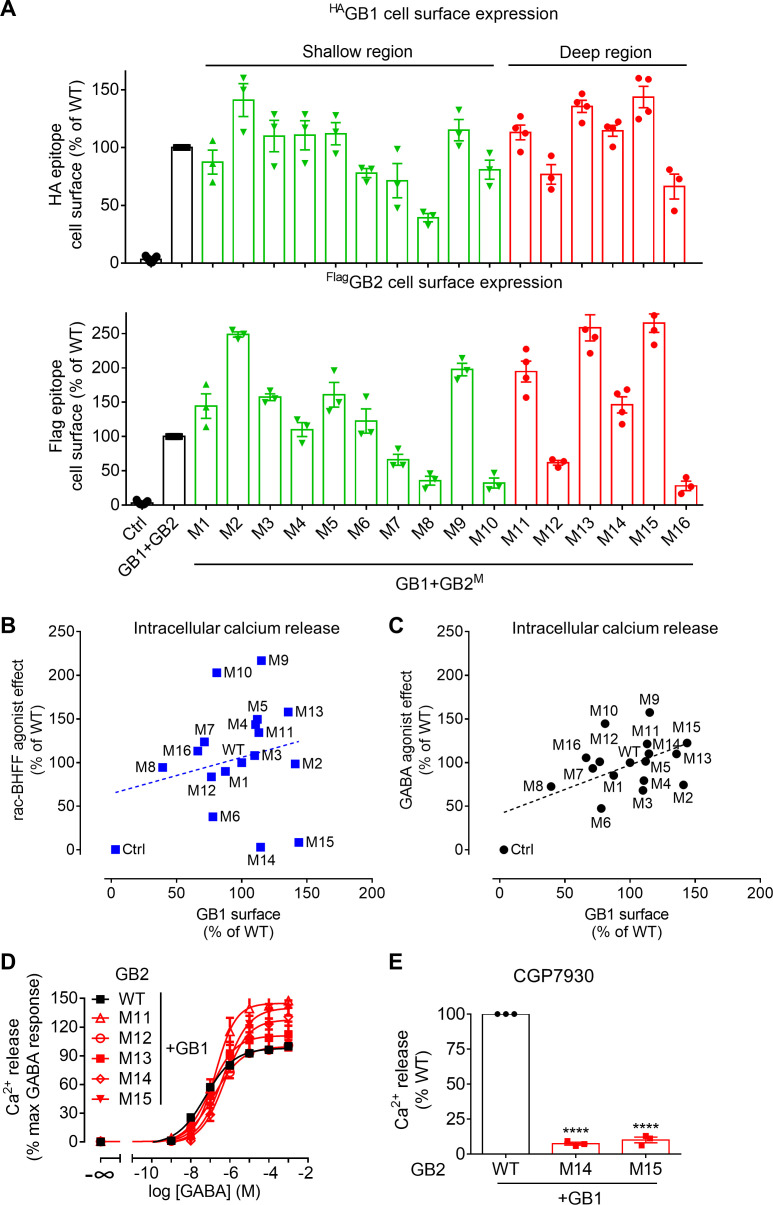
(A) Cartoon highlighting a possible second binding site (dotted oval) for the PAMs in the ancestral ligand binding pocket of the GB2 TMD. In the structure of the inactive state, this pocket is occupied by one molecule of phospholipid (shown as yellow sticks). The residues (α-carbon) of this phospholipid binding pocket (green) and the residues underneath (red) were changed to evaluate their importance in the agonist activity of rac-BHFF. The highly conserved residues L3.36 and Y5.44 were mutated into Ala; G6.53 conserved in GB2 were changed to Thr conserved at this position in GB1, or Phe conserved at this position for other class C GPCRs such as mGlu and CaSR; in Mut 8, the non-conserved residues 7.26NVQ7.28 were mutated in their equivalent in GB2 Drosophila; V7.35 conserved in GB2 (Val or Phe) was changed to Phe. (B) Intracellular Ca2+ responses mediated by the indicated GB2 mutants (M1 to M16) coexpressed with the wild-type GB1 subunit upon stimulation with 30 μM rac-BHFF or 1 mM GABA. Data are normalized by wild-type response and expressed as means ± SEM of three biologically independent experiments. (C) Intracellular Ca2+ responses mediated by the indicated constructs upon stimulation with rac-BHFF in the presence of EC20 GABA of each combination. Data are normalized by wild-type response of 100 μM rac-BHFF + EC20 GABA and shown as means ± SEM. (D) Basal inositol-phosphate-1 (IP1) accumulation mediated by the indicated constructs. Data are normalized by the response of the wild-type and shown as means ± SEM of five biologically independent experiments. Data are analyzed using one-way ANOVA test followed by a Dunnett’s multiple comparison test to determine significance (compared with the WT) with ***p<0.0005, ****p<0.0001. (E) Correlation between the GABAB constitutive activity measured using the Go protein BRET sensor and the rac-BHFF agonist effect for the WT GB1 subunit coexpressed with the indicated GB2 mutants. Data are normalized by the response of the wild-type and shown as means ± SEM. (F) Basal IP1 accumulation mediated by the indicated constructs, including the genetic mutation A567T identified in human GB2 that is equivalent to the mutation A566T in rat. Data are normalized by the response of the WT and shown as means ± SEM of 3–4 biologically independent experiments. Data are analyzed using an unpaired t-test for human, and one-way ANOVA test followed by a Dunnett’s multiple comparison test to determine significance (compared with the WT) for the rat, with *p<0.05, ***p<0.0005, ****p<0.0001. (G) Top view of the sodium binding pocket within the structure of human A2A adenosine receptor (PDB 4EIY) where the three residues important for Na+ interactions are highlighted (Cα in red), the equivalent residues identified in human GB2 TMD (PDB 6UO8), and human mGluR5 TMD (PDB 4OO9); the X.50 numbers shown for A2AAR are equivalent to the numbers in mGluR5 on the basis of X.50 residues defined in Doré et al., 2014; TM2, TM3, and TM7 that contain the residues involving the identified region are highlighted in cyan. (H) Basal IP1 accumulation mediated by the indicated WT and mutated mGlu5 receptors in the presence of the co-transfected glutamate transporter EAAT3. Data are normalized by the response of the WT and shown as means ± SEM of four biologically independent experiments. Data are analyzed using one-way ANOVA test followed by a Dunnett’s multiple comparison test to determine significance (compared with the WT), with **p<0.005. For clarity, the residue numbers for GB2 subunit are based on the sequence of rat GB2. Negative controls (Ctrl) are HEK293 cells co-transfected with the empty vector and Gαqi9 cDNA (B), or Gαo-Rluc and Gβ1γ2-Venus cDNAs in the absence of receptor (E).

