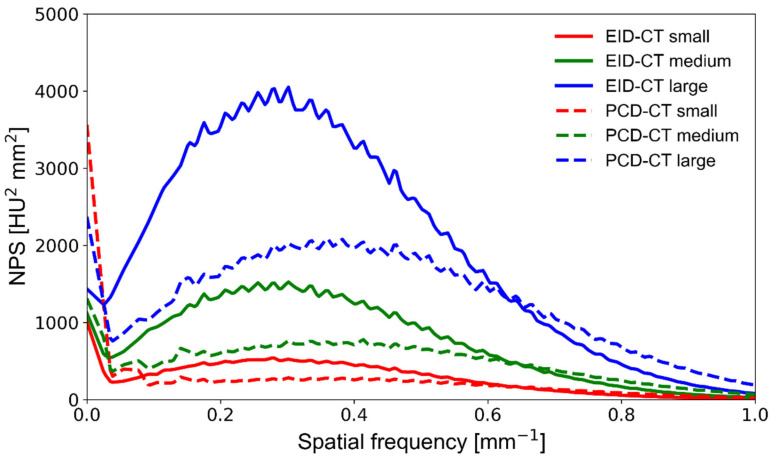
Figure 3.
NPS curves obtained on a clinical EID-CT (solid lines) and a prototype PCD-CT (dashed lines) system at various phantom sizes. The area under the curve is representative of the noise magnitude, whereas the NPS center frequency indicates differences in noise texture. NPS—noise power spectrum; PCD-CT—photon-counting detector computed tomography; EID-CT—energy-integrating detector computed tomography.

