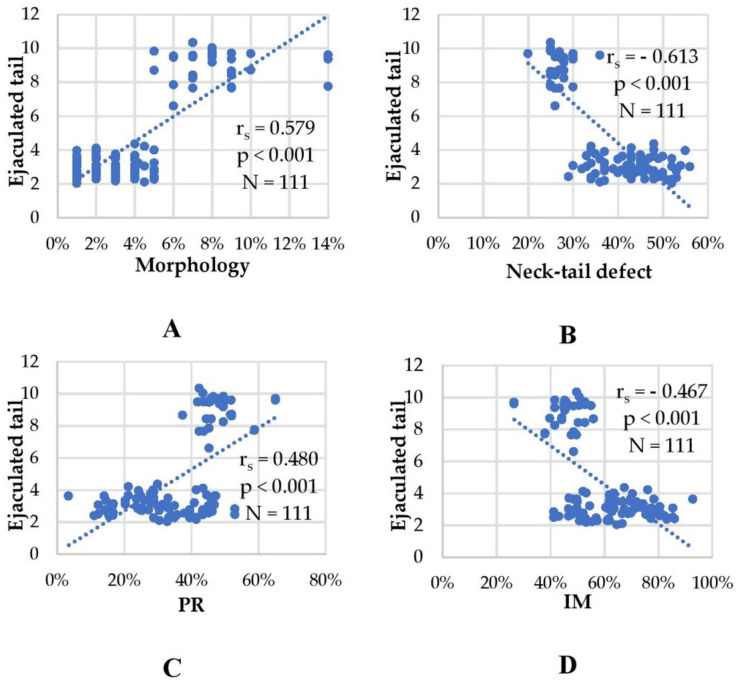
Figure 5.
Correlation between the area of expression of tACE protein in the tail (neck and mid-piece) and sperm characteristics of ejaculated spermatozoa. Scatter plots showing the tACE protein expression area in the neck and mid-piece related to percentage of sperm with normal morphology (A); percentage of sperm with defect in neck and mid-piece (B); percentage of sperm with progressive motility (PR) (C); percentage of immotile sperm (D). Due to the absence of a normal distribution in most indicators and the heteroscedasticity of the points in the scatter plot, the nonparametric Spearman rank coefficient (rs) was used.

