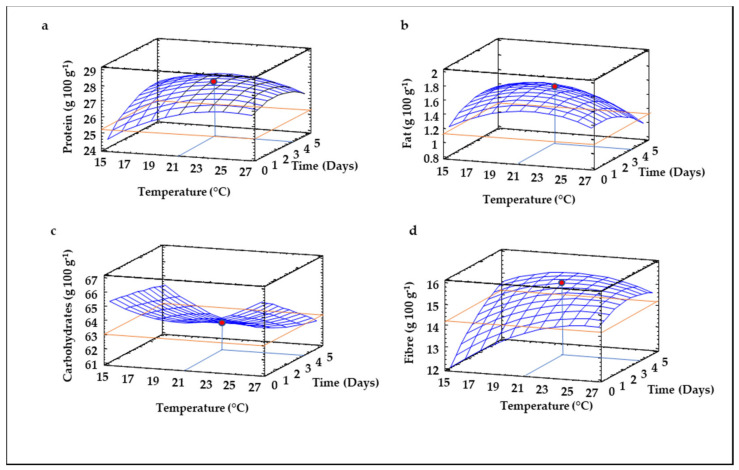
Figure 1.
Three-dimensional Response Surface Plots for the content of total protein (a), fat (b) carbohydrates (c), and fiber (d) as a function of the interaction between germination temperature and time. The red line corresponds with the control (ungerminated seed) and the red point with the value for optimum conditions (21 °C and 3.5 days).

