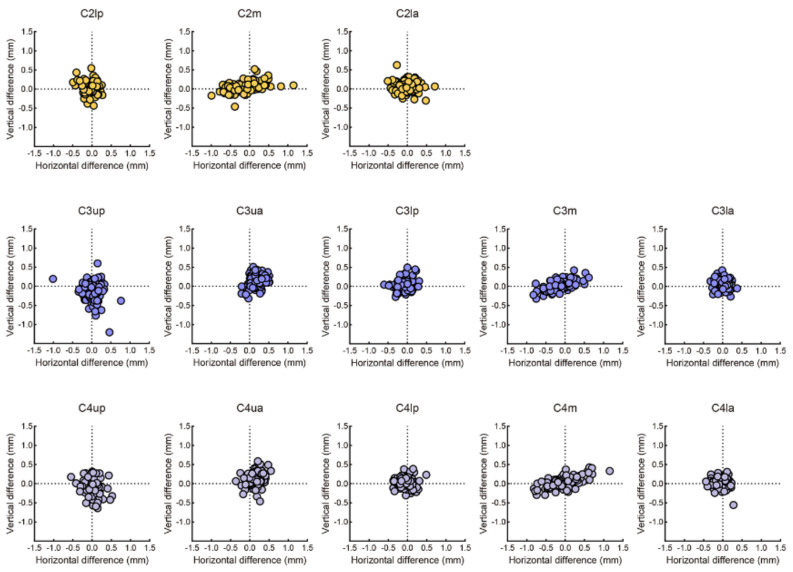
Figure 5.
Scattergram representation of the labelling difference between AI and human. The mean differences between AI and human of C2 landmarks (line 1) were 0.29 ± 0.25 mm, 0.47 ± 0.33 mm, 0.35 ± 0.27 mm, respectively. The mean differences between AI and human of C3 landmarks (line 2) were 0.48 ± 0.38 mm, 0.42 ± 0.24 mm, 0.24 ± 0.15 mm, 0.37 ± 0.28 mm, 0.24 ± 0.17 mm, respectively. The mean differences between AI and human of C4 landmarks (line 3) were 0.42 ± 0.36 mm, 0.43 ± 0.27 mm, 0.25 ± 0.21 mm, 0.46 ± 0.27 mm, 0.27 ±± 0.18 mm, respectively.

