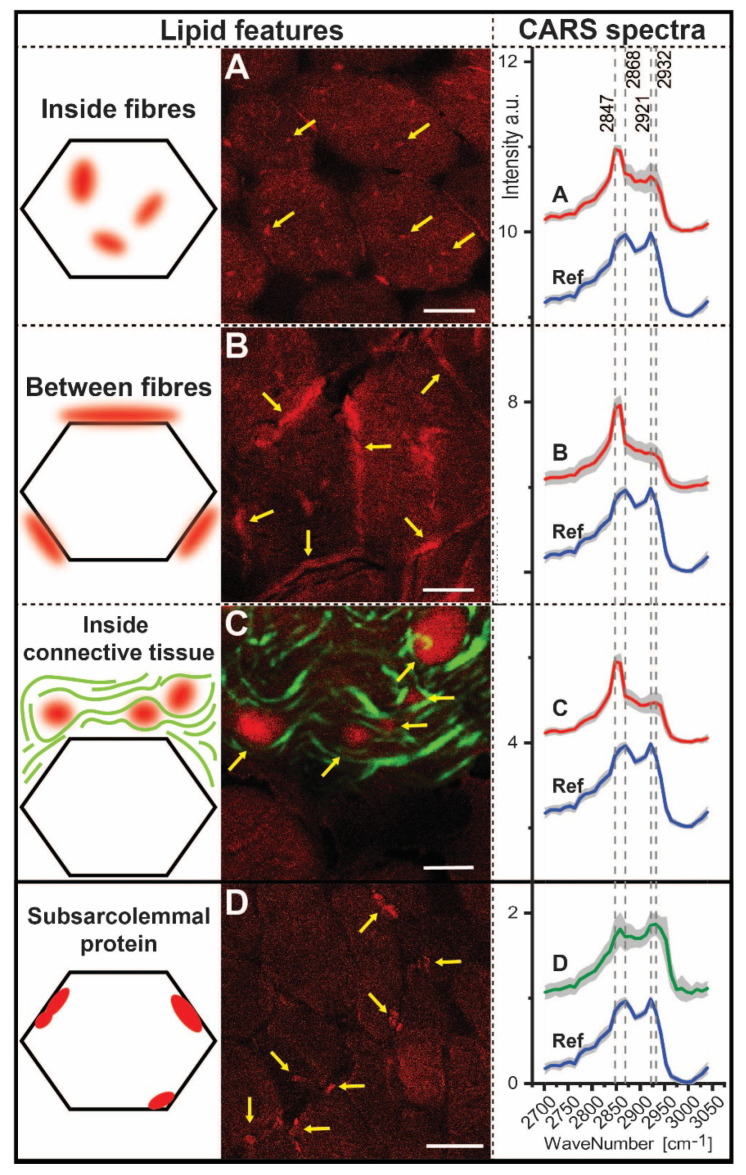
Figure 4.
Spectroscopic findings in the muscle biopsies of the SLC18A3 patient determined from CARS and SHG measurements. CARS images in forward direction (F-CARS) are shown in red and F-SHG images in green. CARS/SHG images showing lipid (A–C) were taken at 2847 cm−1; otherwise 2953 cm−1 (D). (A) Lipid accumulation within a muscle fibre with high F-CARS signal at 2847 cm−1 (marked with arrows, Scale bar: 20 µm). (B) Lipid accumulation between muscle fibres with high F-CARS signal at 2847 cm−1 (marked with arrows, 10 µm). (C) Lipid accumulation within connective tissue with high F-CARS signal at 2847 cm−1 (marked with arrows). Collagen fibres are detected with F-SHG (7.5 µm). (D) Subsarcolemmal protein accumulations with F-CARS signals at 2921 cm−1 and 2932 cm−1 (20 µm). A total of 283 CARS spectra were used; A: 85, B: 80, C: 24, D: 54, reference: 40.

