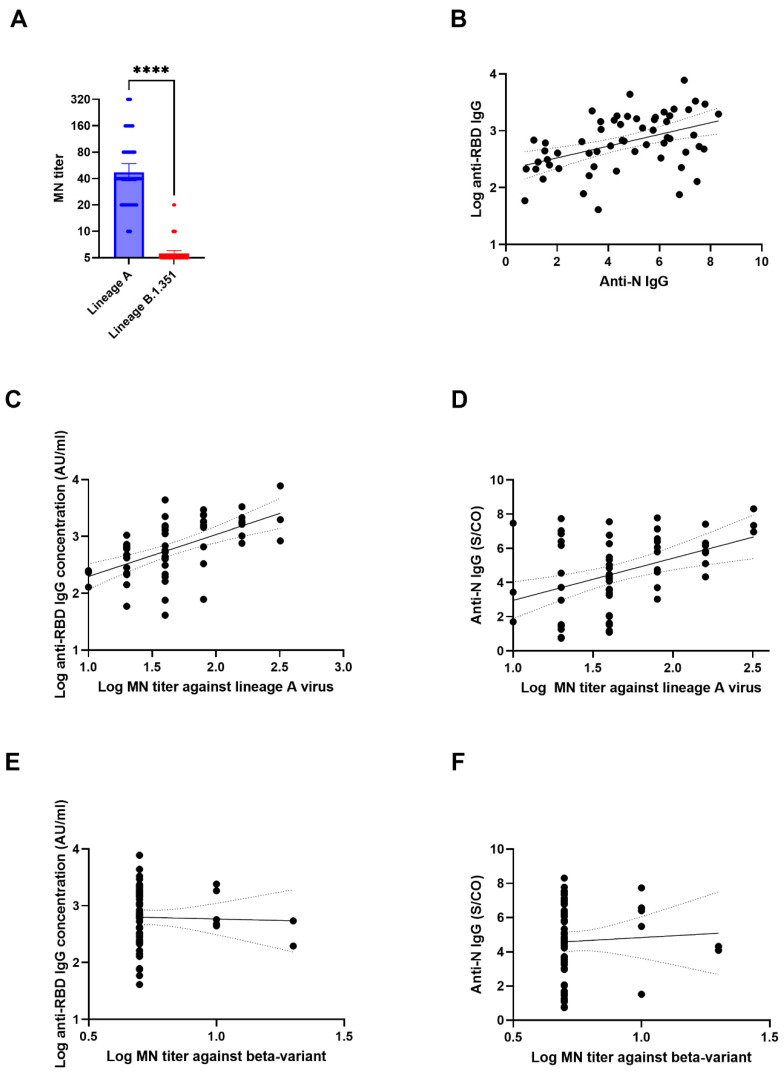
Figure 1.
Correlation between MN titer and anti-N or anti-RBD IgG titers. (A) Comparison between MN titers against wild type lineage A virus (HKU-001a) and lineage B.1.351 virus (beta variant). The data represent geometric mean titer and 95% confidence interval ****, p < 0.0001. (B) Correlation between anti-RBD IgG and anti-N IgG. (C,D) Correlation between MN titer against wild type lineage A and anti-RBD IgG (C) or anti-N IgG (D); (E,F) Correlation between MN titer against lineage B.1.351 and anti-RBD IgG (E) or anti-N IgG (F). For (B–F), the solid lines indicate the best fit line, while the dotted lines indicate the 95% confidence interval.

