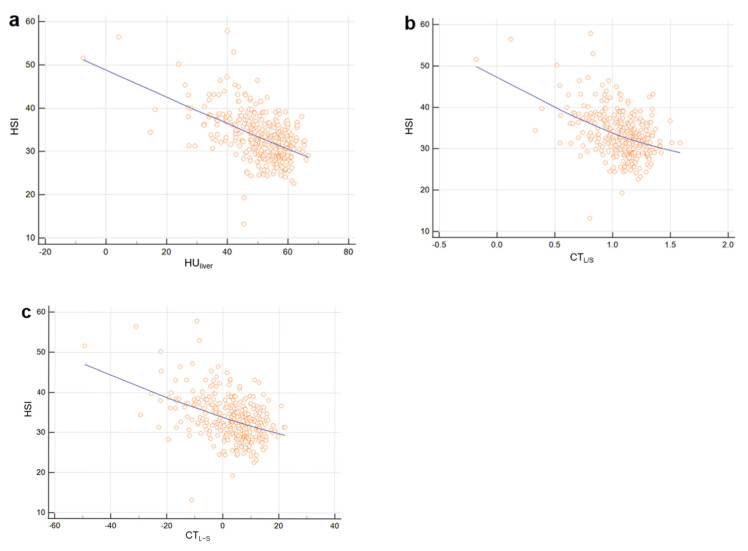
Figure 3.
Scatter plots of HSI level as a function of HUliver (a), CTL/S (b), and CTL-S (c). Solid lines represent best-fit linear regression. HSI showed moderate negative correlation with criterion (a) (Spearman’s coefficient of rank correlation rho (r) = −0.531) and showed weak negative correlations with criteria (b) and (c) (r = −0.436 and −0.437, respectively).

