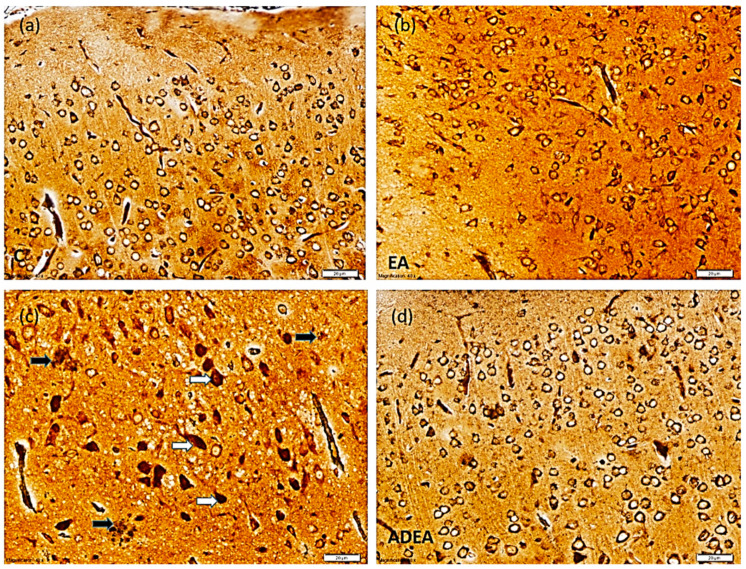
Figure 4.
Photomicrograph showing normal ERC structure in the control (a) and EA (b) groups. The sections from the AD (c) group showed multiple NFTs (white arrows) with NPs in between (black arrows). Sections from the ADEA (d) group revealed a few scattered NFTs among normal neurons. (Silver, magnification ×40, scale bar 20 µm).

