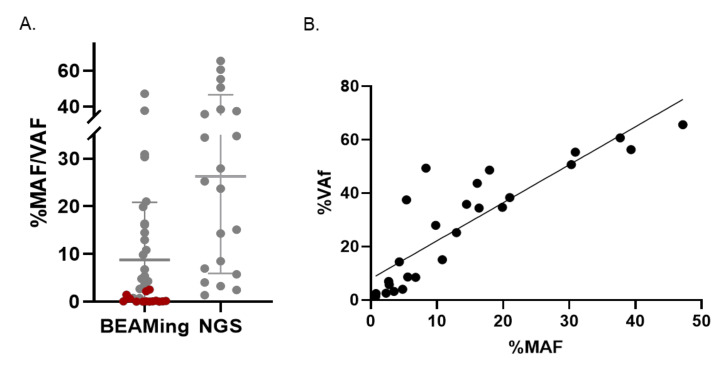
Figure 2.
Comparison of RAS variants identified by BEAMing dPCR and NGS. (A) Scatter plot represents the mutant allele frequency (MAF) of plasma RAS (KRAS/NRAS) variants detected by BEAMing dPCR and the variant allele frequency (VAF) of these variants detected by NGS. Variants identified by both dPCR and targeted NGS are shown in grey (n = 21). Variants identified only by BEAMing dPCR are shown in red (n = 14); (B) Pearson correlation analysis of NGS VAF and dPCR MAF levels (n = 26, R2 = 0.7674, Pearson r = 0.8760).

