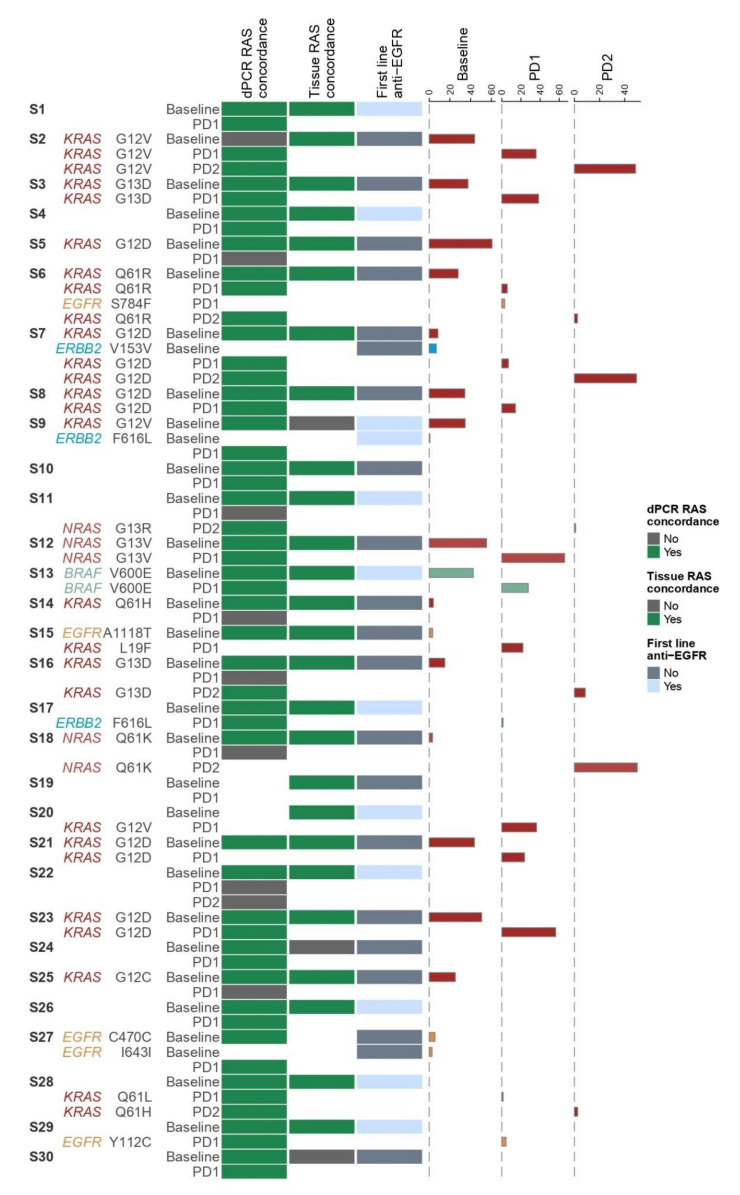
Figure 3.
Heatmap of NGS data analysis in ctDNA in association with clinical parameters. From left to right, the patient/sample ID is mentioned (S1–S30). In case of a detected variant the gene name and the amino acid change is mentioned. Next, the disease status at sample collection (Baseline, PD1, PD2) is indicated. The first column of the heatmap, describes the concordance of RAS testing between NGS and dPCR (green: concordant, grey: discordant). Similarly, the second column presents the concordance of RAS testing in tissue and ctDNA by NGS (green: concordant, grey: discordant). In the next column, it is indicated whether the patients had received anti-EGFR therapy at baseline or not (grey: no, light blue: yes). On the right, the percentages of VAF of each variant, in each time point (Baseline, PD1, PD2) are plotted. NGS: Next-generation sequencing; dPCR: digital PCR; ctDNA: circulating tumor DNA; EGFR: Epidermal growth factor receptor; VAF: Variant allele frequency; PD1: 1st disease progression; PD2: 2nd disease progression.

