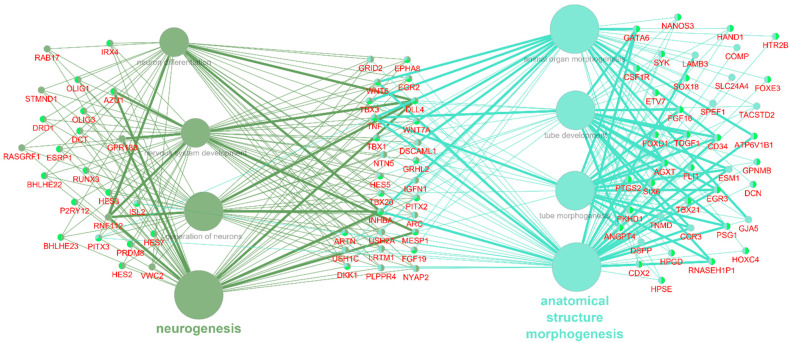
Figure 3.
GO BP terms from groups I and II, significantly enriched with DEG NPC with DEG, associated with at least 2 terms. Genes in the middle are associated with terms from groups I and II. Genes on the left are associated with terms from group I, genes on the right are associated with terms from group II.

