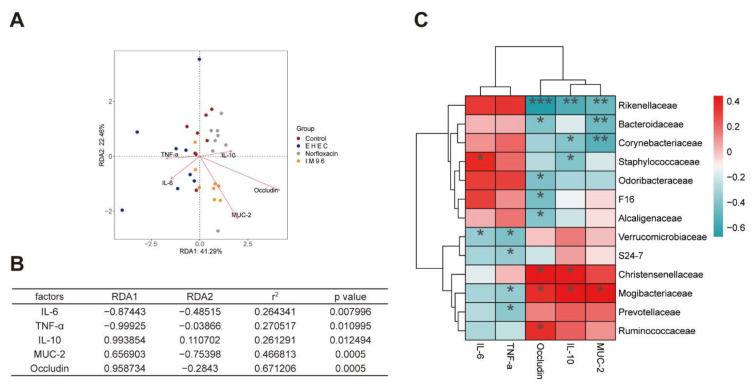
Figure 7.
Correlation analysis of environmental factors. (A) RDA of intestinal microbiota distribution and environmental factors. The arrows indicate the environmental factors, and the length of the arrow line indicates the degree of correlation between the environmental factor and the sample distribution. The longer the line, the greater the correlation. The angle between the arrow line and the sort axis and the angle between the arrow line indicates the correlation. The smaller the angle, the higher the correlation; (B) the significance of environmental factors was analyzed by envfit function. r2 is determinant coefficient of environmental factors on intestinal microbiota distribution; (C) correlation heatmap, * p < 0.05, ** p < 0.01, *** p < 0.001.

