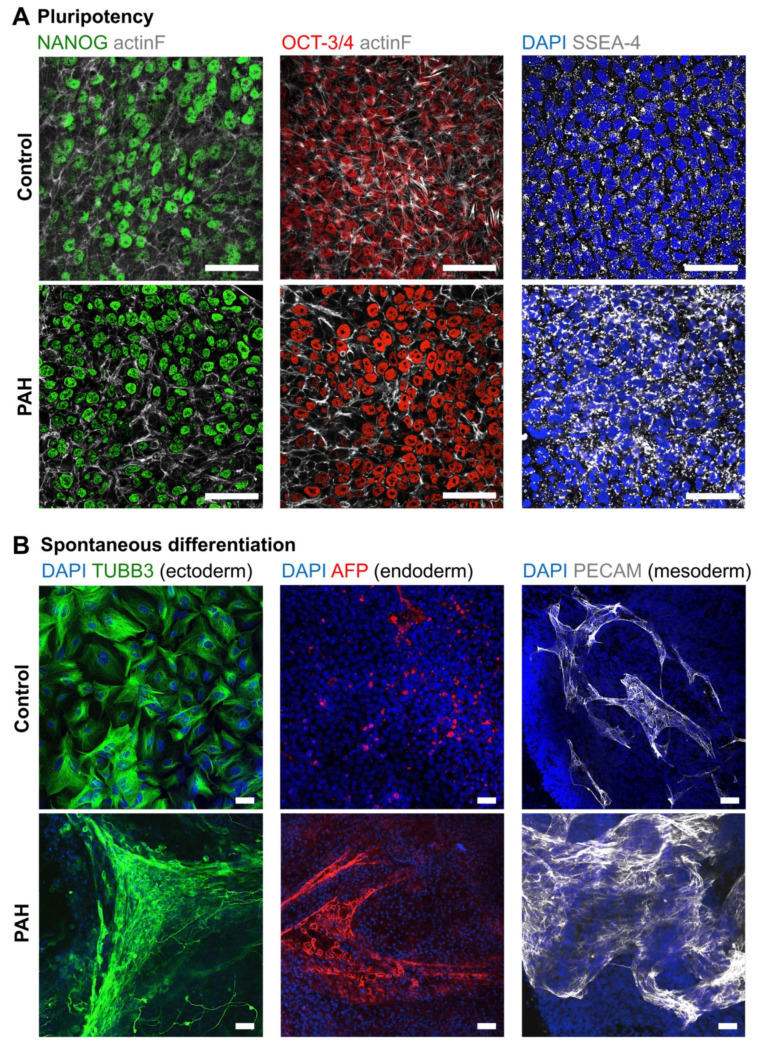
Figure 2.
Pluripotency and spontaneous differentiation capacity of the control and PAH iPSCs. (A) Representative images confirming protein expression of pluripotency (NANOG, OCT-3/4, and SSEA-4) markers on the control and PAH iPSCs. (B) Representative images confirming protein expression of spontaneous differentiation markers (TUBB3, AFP, and PECAM) on the control and PAH iPSCs. Scale bars = 50 µm.

