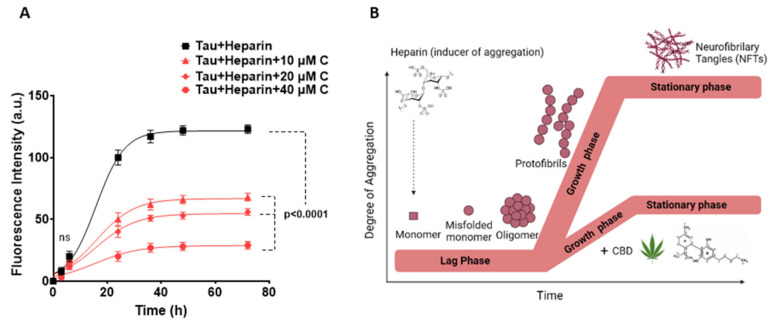
Figure 2.
Aggregation kinetics of heparin-induced tau protein in the absence and presence of CBD. (A) ThT fluorescence assay to evaluate the kinetics of tau protein aggregation in the absence and presence of 10, 20 and 40 μM CBD after pre-induction with heparin. The aggregation kinetics of tau is plotted as fluorescence intensity of tau protein (a.u.) vs. time (h). The best-fitting curves for aggregation kinetics of tau follow a sigmoidal profile and a reduced rate appears in the presence of 10, 20, and 40 µM CBD. In addition, the kinetic changes of aggregation of tau alone were measured as zero constantly over time, so this result is not added in the kinetics plot. (B) Schematic representation of the three phases in the tau protein aggregation including lag phase, growth phase, and steady phase using the heparin inducer in the presence and absence of CBD. All data points are given as mean ± SD of three independent experiments (n = 3). P-value < 0.0001 is considered as statistically significant as determined by one-way ANOVA (Dunnet test) for the comparison between each data point vs. tau + heparin.

