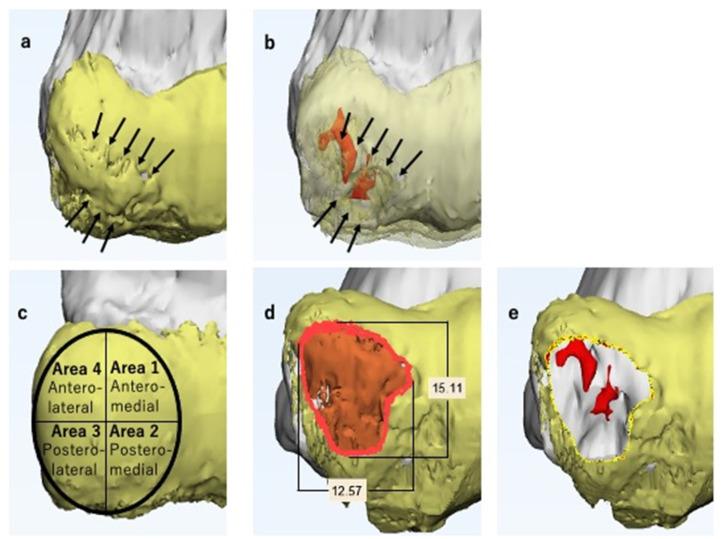
Figure 5.
Magnetic resonance imaging-computed tomography fusion images (MCFIs). Here, the 3D CT model of the humerus and the 3D MRI model of the articular cartilage are shown in gray and yellow, respectively. (a) Anteroposterior view of the lesion (enlarged). The articular cartilage fissures (ACFs) can be observed (arrows). The articular surface is protruded and not smooth, particularly in the area surrounded by the fissure. (b) Anteroposterior view of the lesion with a transparent articular cartilage (enlarged). The segmented subchondral bone is shown in red and is located beneath the fissure (arrows). Considering all the findings, we predicted the lesion as unstable. (c) On the anteroposterior view of the MCFI, we divided the surface into four areas and recorded the location of each finding. (d) The lesion is marked in orange. The vertical and horizontal diameters of the lesion were measured. We determined the size of the lesion comprehensively based on the findings of the articular cartilage and subchondral lesion. (e) Simulated image of the lesion resection. We separated the area selected in Figure 5d from the original three-dimensional magnetic resonance imaging articular cartilage model and hid it to simulate lesion selection.

