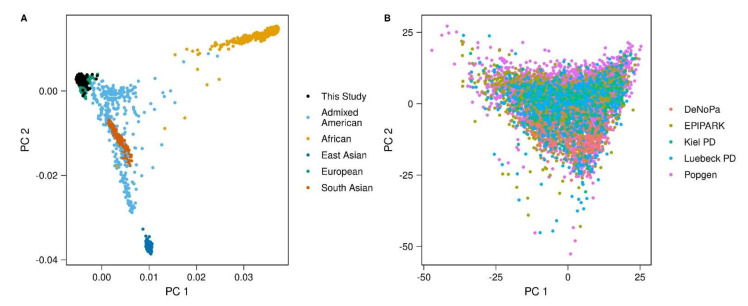
Figure A2.
PCA plots after quality control. (A) Plot of the first two PCs from the 1000Genomes supra populations and the samples of this study. Our study samples were plotted on top, therefore obscuring part of the European samples from the 1000Genomes project. (B) Plot of the first two PCs from the cohorts included in our study (Table A1). PC: principal component, PCA: principal component analysis.

