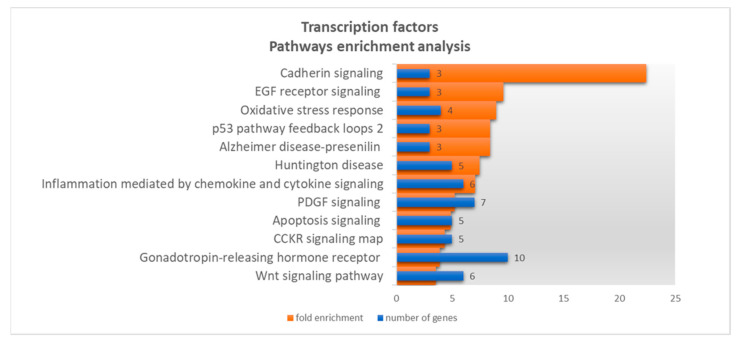
Figure 2.
Gene ontology results for 80 potential NAPRT transcription factors, based on pathways annotation dataset, showing the number of genes (blue bars) and fold enrichment (orange bars) by decreasing fold enrichment order. Detailed information on GO results can be found in Supplementary Table S4. The genes responsible for the highest enrichment fold were retrieved (TCF7L2, TCF3 and LEF1).

