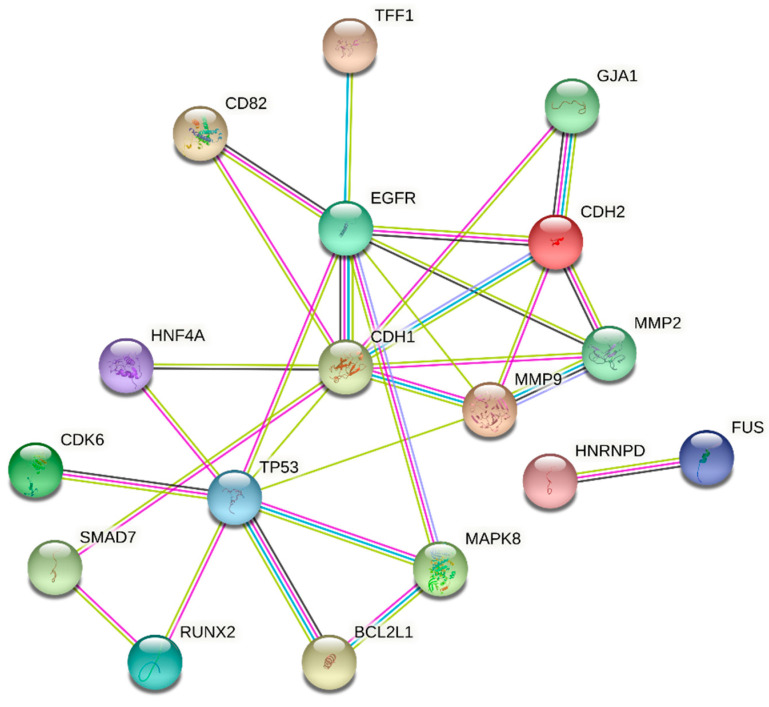
Figure 4.
Network of interactions between 17 genes targeted by more than one NAPRT potential regulator. The network was obtained by using STRING (string-db.org). The line color of the edges indicates the type of interaction evidence: experimentally determined (pink), from curated databases (light blue), text mining (light green), co-expression (dark grey) and protein homology (purple). The color of the nodes is arbitrary.

