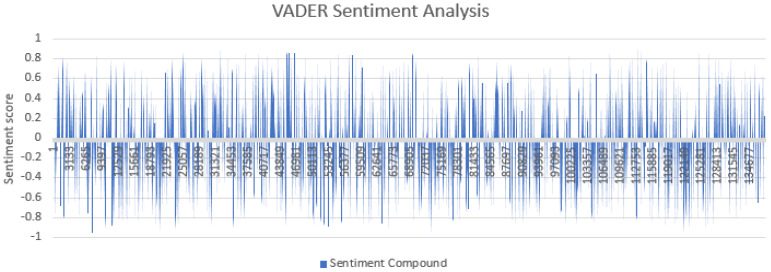
Figure 1.
VADER sentiment scores for each tweet. Values greater than 0.05 are displayed as positive, values between −0.05 and 0.05 are neutral and values less than 0.05 are negative tweets. The lengths of the peaks represent the intensity of negativity or positivity. Values represent the tweet number. The horizontal axis shows the tweets in order, ranging from 1 July 2021 (left of graph) to 21 July 2021 (right of graph).

