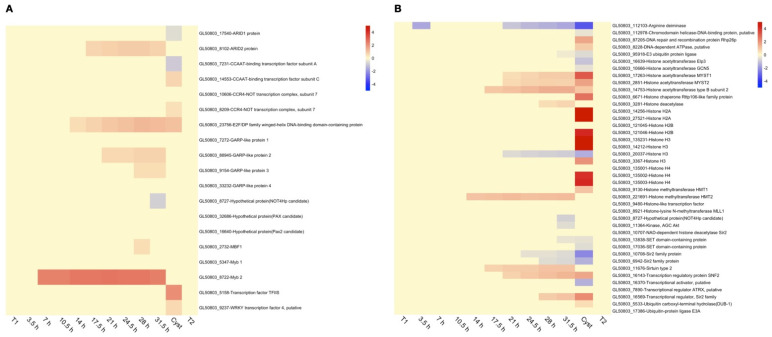
Figure 2.
Heat-map showing expression changes through-out encystation of (A) transcription factors and (B) chromatin modifiers. All changes are in log2 space and capped at −5 and 5, respectively, to improve visualization. Up-regulation is shown in red, while down-regulation is shown in blue. For each gene, the unique Geneid (starting in GL50803_) and the annotated function is given.

