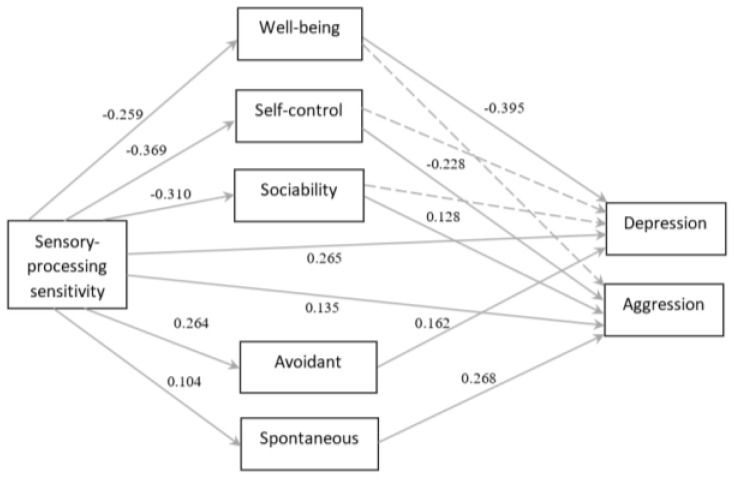
Figure 2.
Results for the path analysis on the total sample. Entries are standardized regression weights. Discontinuous lines represent nonsignificant paths. Non-Normed Fit Index TLI = 0.953; Comparative Fit Index CFI = 0.992; root mean square error of approximation RMSEA = 0.056; chi-square χ2 (5) = 9.253, p > 0.05.

