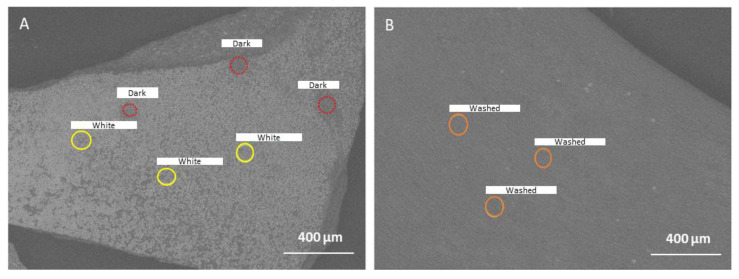
Figure 2.
SEM image of the seaweed surface of (A) initial gametophyte Chondrus crispus chips and (B) gametophyte Chondrus crispus after washing and drying. The circles indicate the region where energy dispersive X-ray (EDX) spectroscopy was performed. ‘White’ indicates the analysis where salt crystals were present, and ‘Dark’ indicates the analysis where salt crystals were not present. ‘Washed’ indicates the analysis on the surface of the seaweed that was washed and then dried. The yellow and red circles only show the different categories of the measured area (“White” vs. “Dark” areas).

