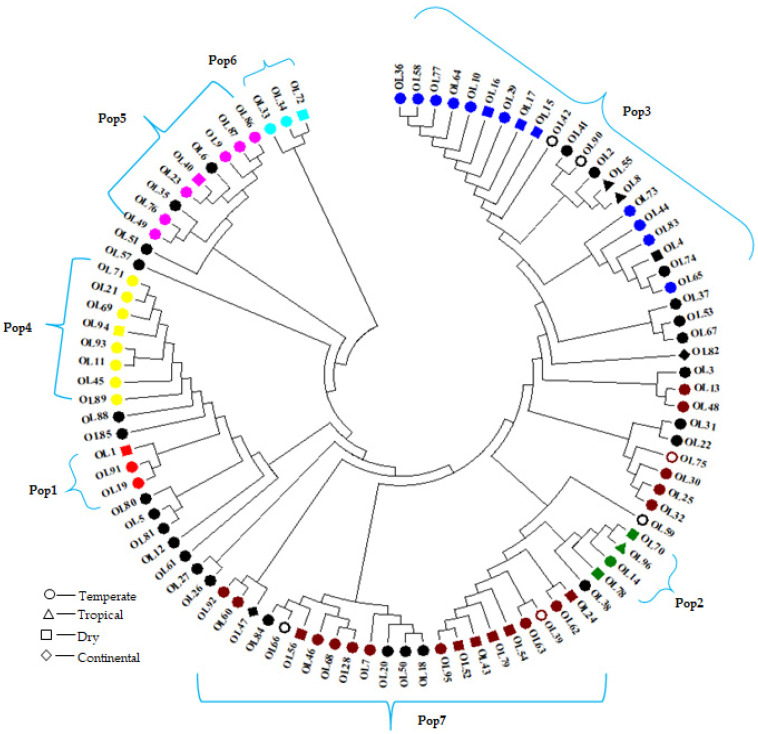
Figure 5.
Phylogenetic analyses of the 96 olive cultivars using the neighbor-joining method. Different colors depict the structure analysis generated populations. Legends indicate the climatic zones from where the accessions were originated. Colors represent different subpopulations of the germplasm; red color = subpopulation1, green = subpopulation2, blue = subpopulation3, yellow = subpopulation4, pink = subpopulation5, cyan = subpopulation6, maroon = subpopulation7, black = admixture group.

