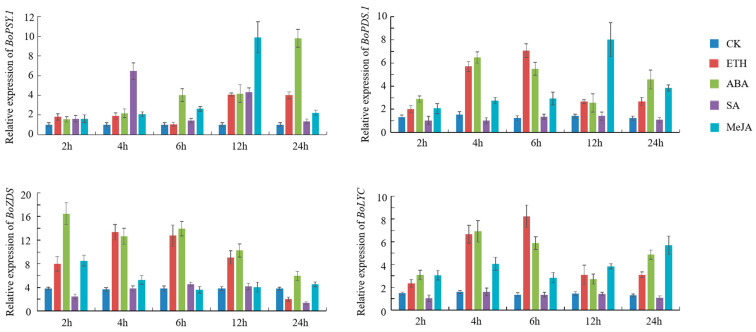
Figure 6.
The expression of BoPSY.1, BoPDS.1, BoZDS, and BoLYC after treatment with exogenous phytohormone. The Y-axis and X-axis represent the relative expression level and the time course of exogenous phytohormone treatment, respectively. Leaves were sampled at 0, 2, 4, 6, 12, and 24 h after ETH, ABA, SA, and MeJA spraying. Data represent the mean ± SD of three technical repetitions.

