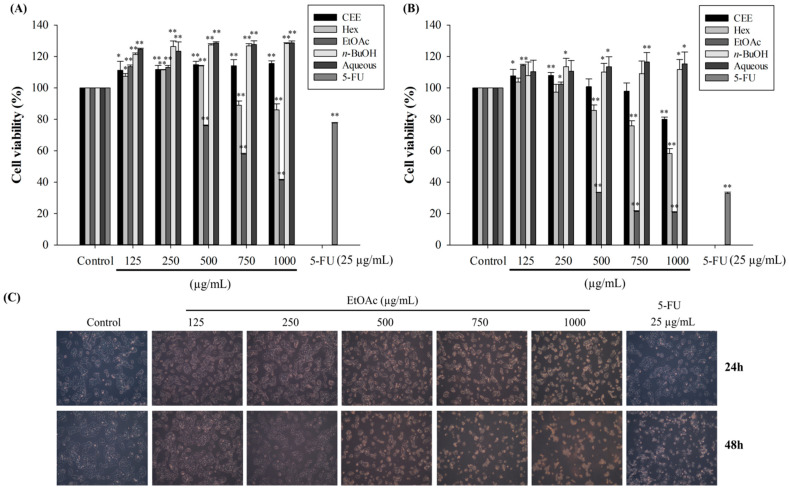
Figure 4.
Antiproliferative effects of CEE and various solvent fractions on HepG2 cells. Cell growth was determined after treatment with 0–1000 µg/mL of CEE and solvent fractions for 24 h (A) and 48 h (B) using the MTT assay. (C) Cell morphology of HepG2 cells was observed by inverted microscopy after treatment with EtOAc fraction for 24 and 48 h. * p < 0.05 and ** p < 0.01, significant difference between the control and the concentration of each sample.

