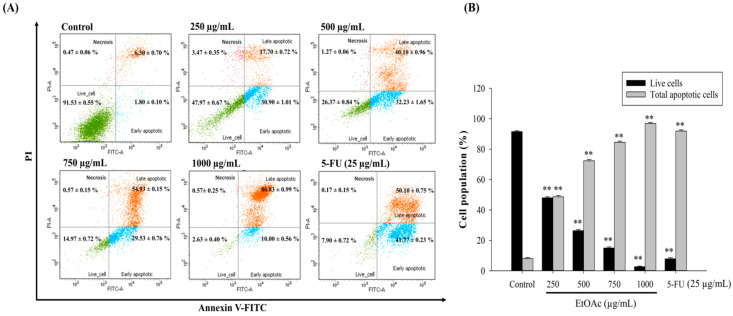
Figure 6.
The effect of the EtOAc fraction on HepG2 cell apoptosis. The cells were treated with 0–1000 µg/mL of the EtOAc 48 h and labeled with Annexin V-FITC and PI, followed by the measurement of cell apoptosis by flow cytometry (A). The bar chart presents the percentage of live cells and total apoptotic cell population of HepG2 cells (B). ** p < 0.01, significant difference between the control and the concentration of the EtOAc fraction.

