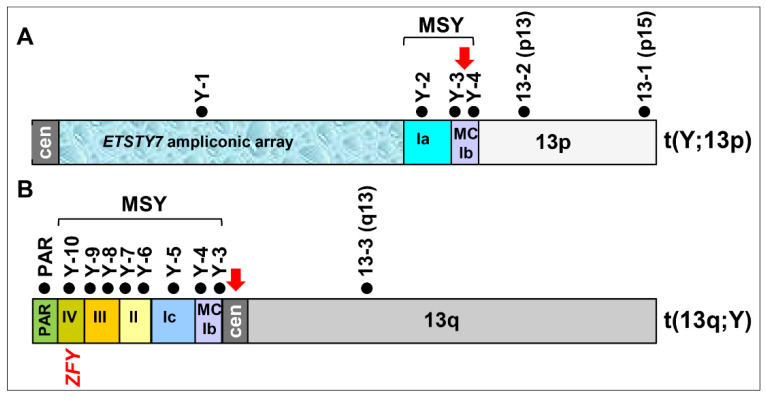
Figure 3.
Schematic representation of the reciprocal translocation between ECAY and ECA13. (A) Aberrant chromosome Y;13p comprised of the proximal ETSTY7 ampliconic array, MSY contigs Ia, part of MC-Ib and ECA13p; (B) aberrant chromosome 13q;Y comprised of ECA13q and the distal portion of MSY, including part of multicopy contig MC-Ib and single-copy contigs Ic, II, III, IV and PAR; black dots with marker IDs above each chromosome denote ECAY and ECA13 markers that were used for refined FISH analysis (see Table 1 and Figure 1 and Figure 2); red arrows indicate translocation breakpoints in ECAY contig MC-Ib and at ECA13 centromere; the location of ZFY, a candidate meiotic executioner gene is indicated.

