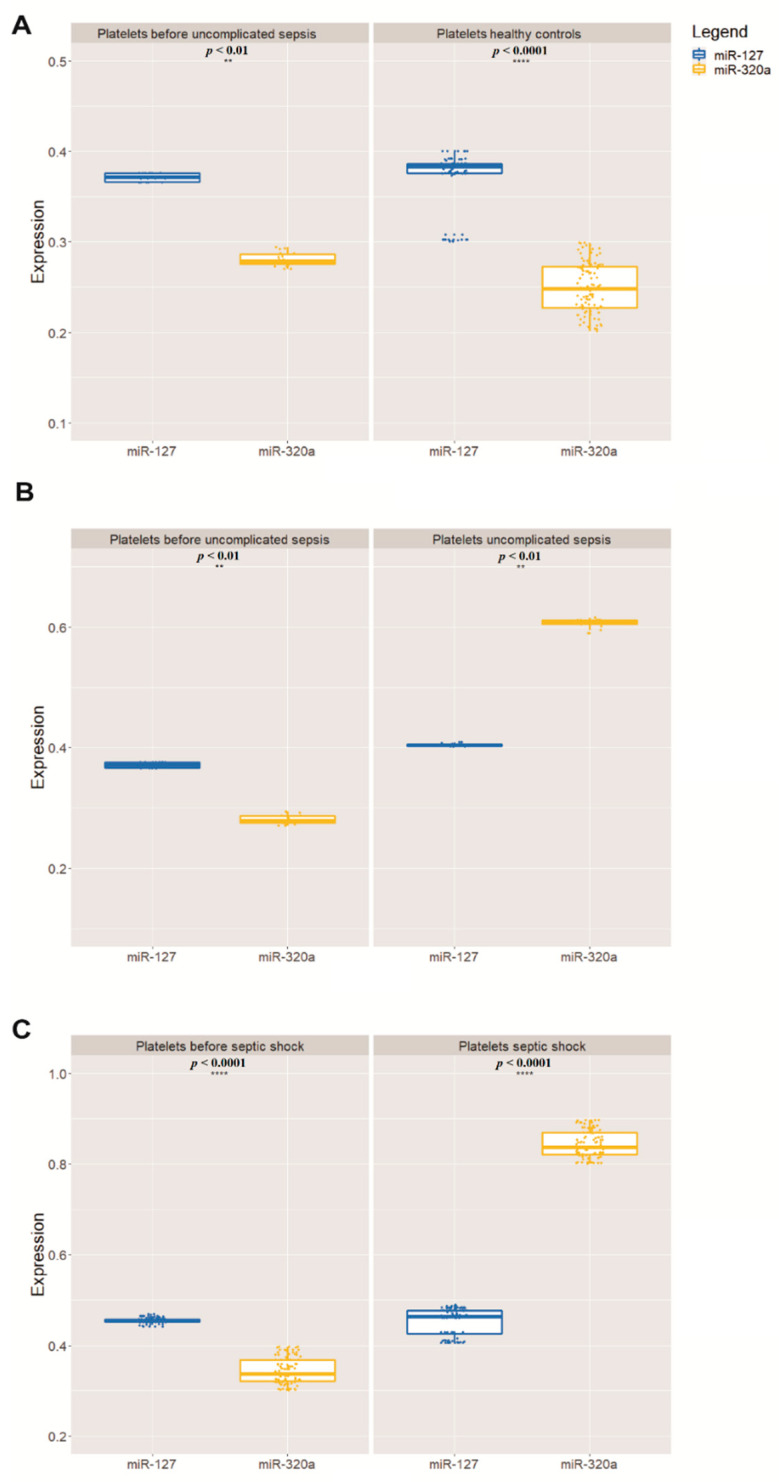
Figure 1.
Relative mean expression of miRNAs quantitative PCR (qPCR) analysis (A). The Wilcoxon paired-sample test was applied to estimate the significance of expression of miR-127 and miR-320a in relation to miR-191 (B), which has been used as an internal control for validation analysis (** p < 0.01, **** p < 0.0001) (C). In all graphs, the X-axis represents the storage time of the PCs and the Y-axis represents the 100 PC units.

